


Entries in jet (15)
CHARTS — SEPT. 13, 2011
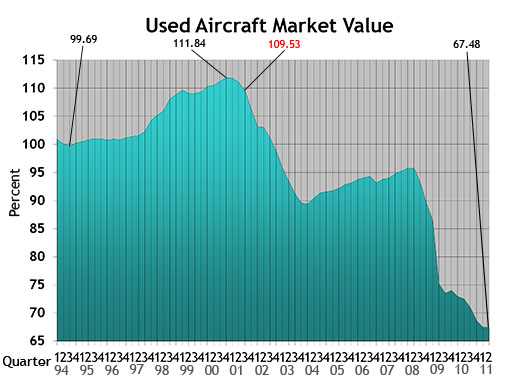
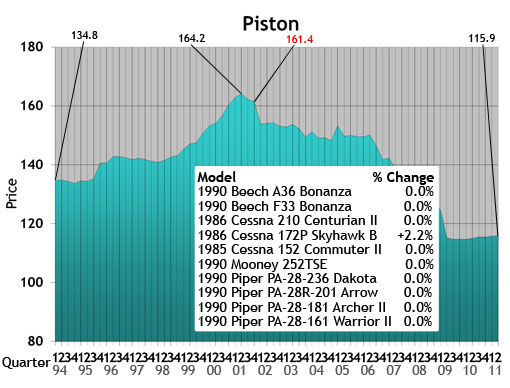
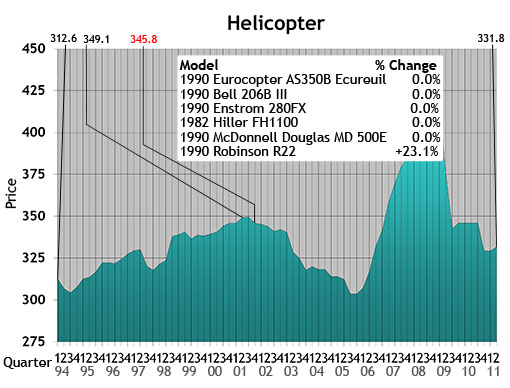
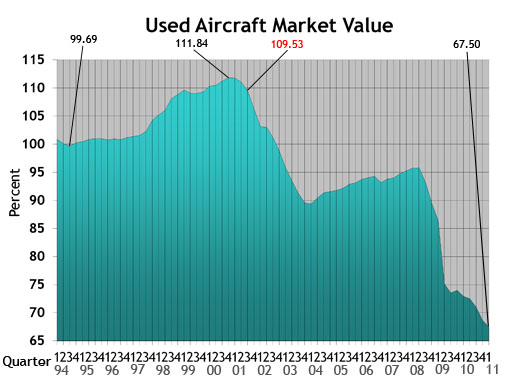
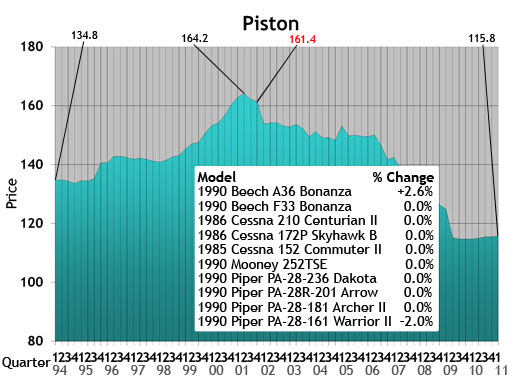
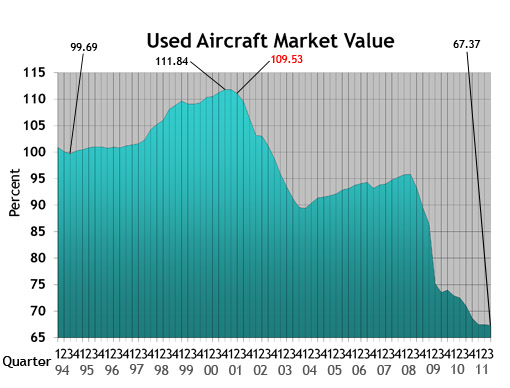 Used Aircraft Market: This chart displays each model's quarterly value in relationship to its average equipped price at the inception of the aircraft. The study begins in the spring quarter of 1994 and includes the Jet, Turboprop, Multi, Piston and Helicopter. For all charts, the red number indicates the first reporting date after 9-11.
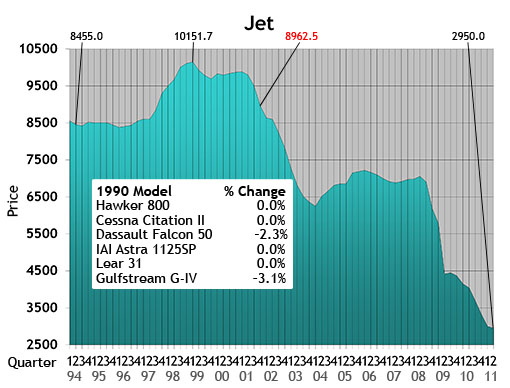
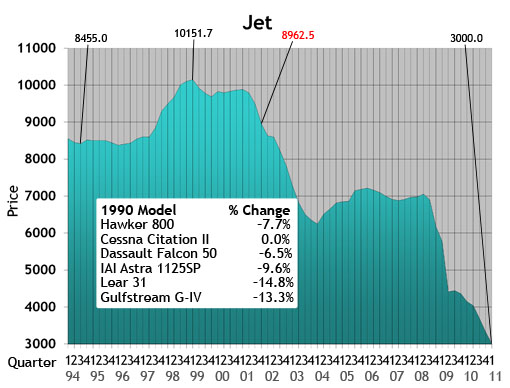
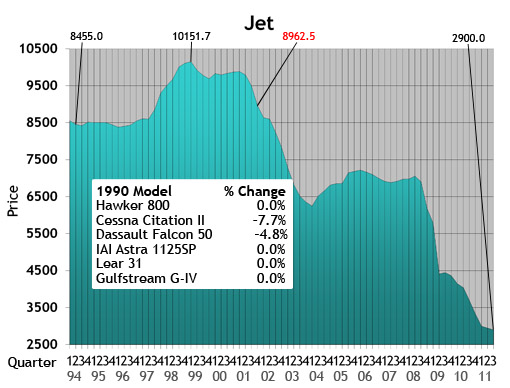 Jet: The jet chart depicts the average price (in thousands) of the six 1990s jets listed in the box.
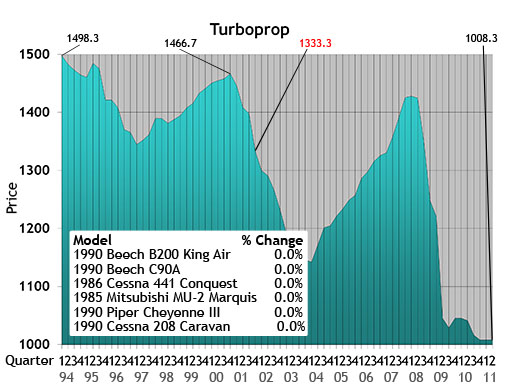
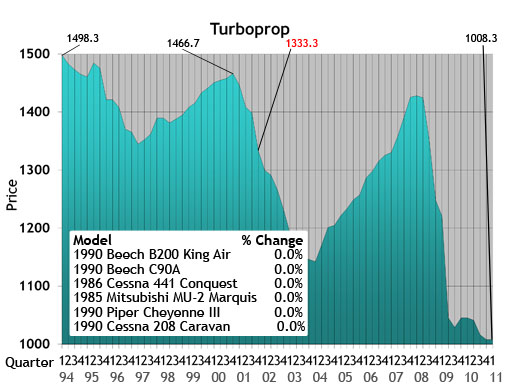
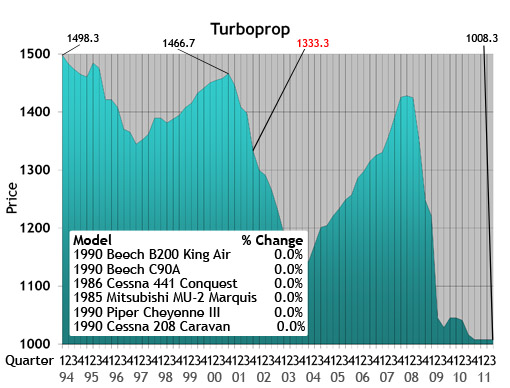 Turboprop: The turboprop chart depicts the average price (in thousands) of a 1985, 1986 and four 1990 turboprops listed in the box.
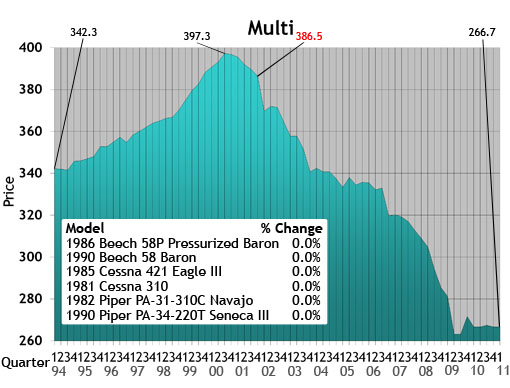
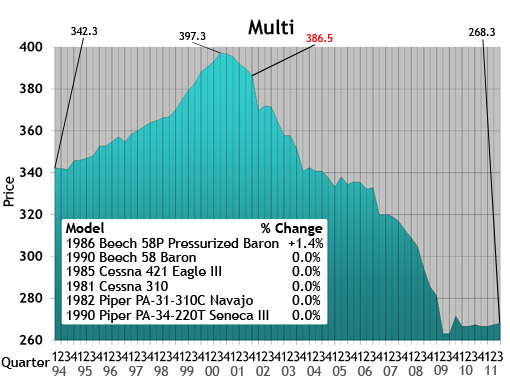 Multi: The multi chart depicts the average price (in thousands) of the six multi models listed in the box. Each model’s year will precede the name of the aircraft.
 Piston: The piston chart depicts the average price (in thousands) of the 10 pistons listed in the box. Each model’s year will precede the name of the aircraft.
 Helicopter: The helicopter chart depicts the average price (in thousands) of the six helicopters listed in the box. Each model’s year will precede the name of the aircraft.
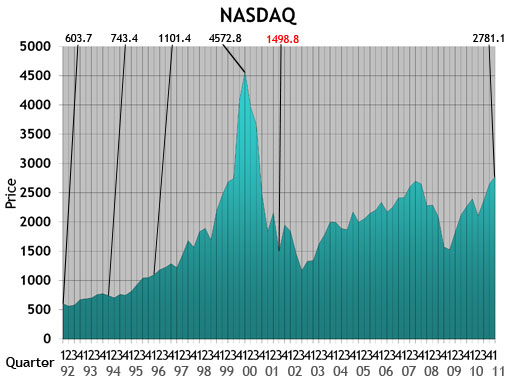
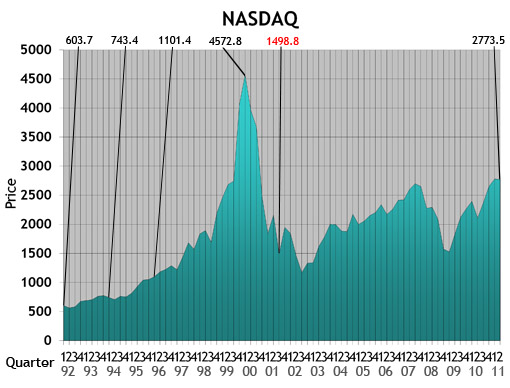 NASDAQ: This ratio scale chart depicts the change for the NASDAQ daily average from quarter to quarter beginning at the end of the first quarter of 1992. Each data point represents the closing daily average on the last trading day of each quarter. This study originates in the first quarter of 1971.
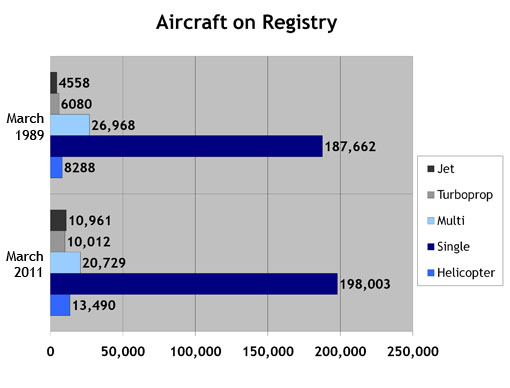
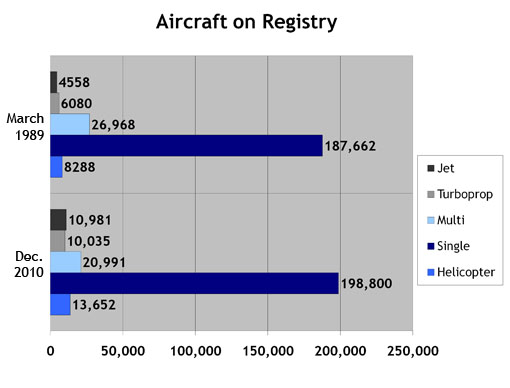
 Aircraft on Registry: The Aircraft on Registry chart depicts the number of aircraft reported in Aircraft Bluebook that are listed on FAA records and considered to be in the U.S. inventory.
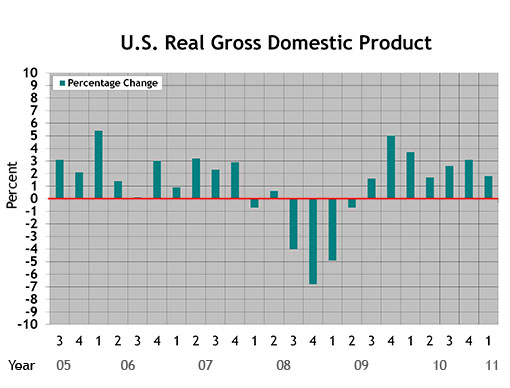
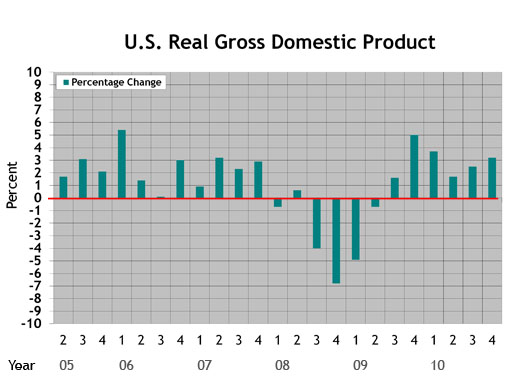
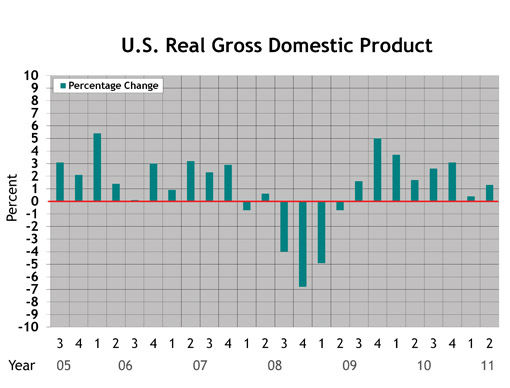 U.S. Real Gross Domestic Product (criteria updated Aug. 27, 2010): This graph represents real gross domestic product measured by the U.S. Bureau of Economic Analysis. Each data point represents the BEA's final figure or latest estimate of the quarter-to-quarter seasonally adjusted annual rates of change in real GDP "based on chained 2005 dollars." The study begins with the second quarter in 2005.
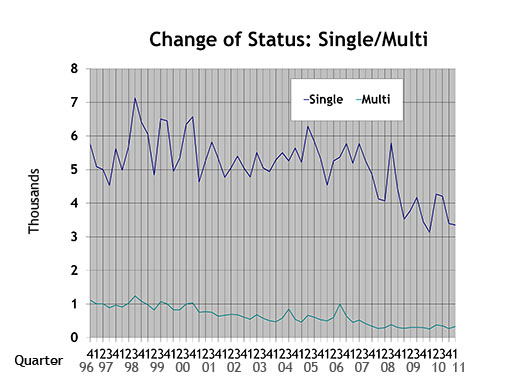
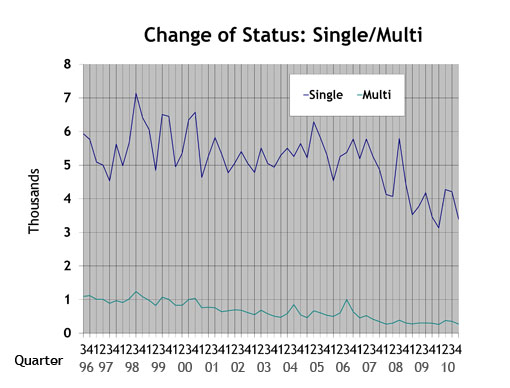
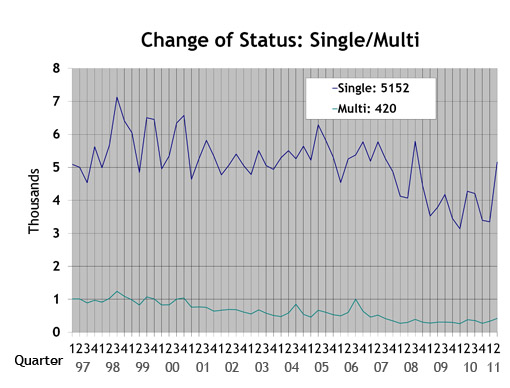 Single/Multi: The blue line in the Single/Multi chart depicts change-of-ownership data for singles. The black line represents multis.
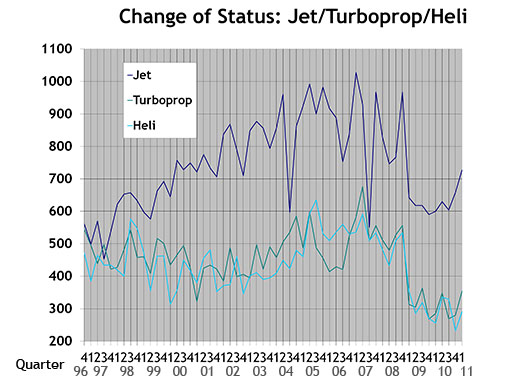
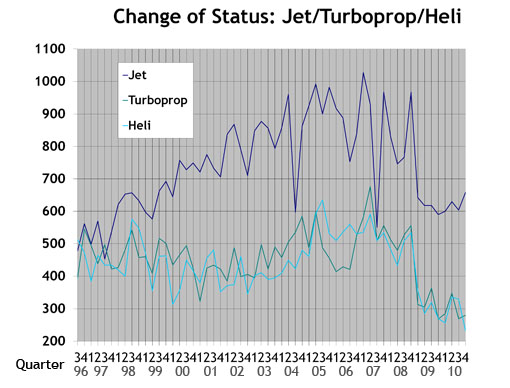
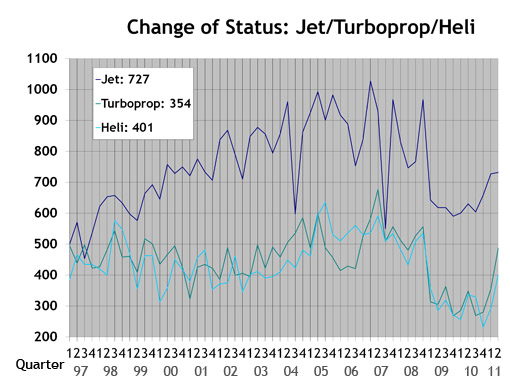 Jet/Turboprop/Heli: The black line in the Jet/Turboprop/Heli chart represents change-of-ownership information for jets. The blue line depicts turboprops, and the gray line represents helicopters.
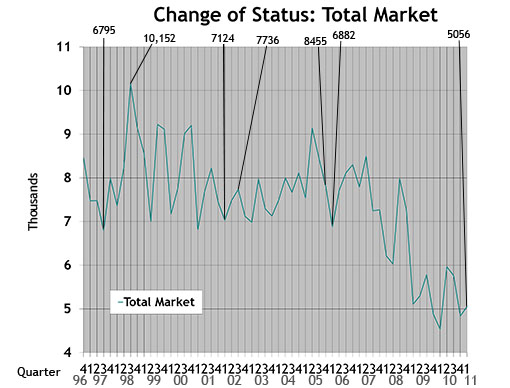
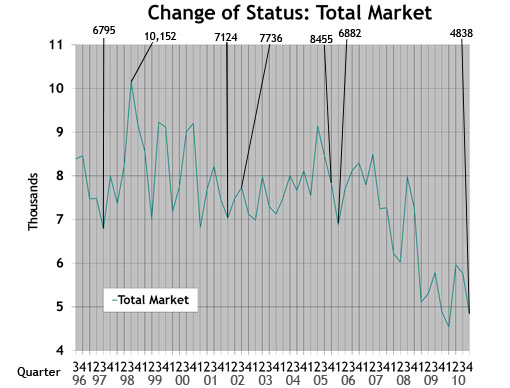
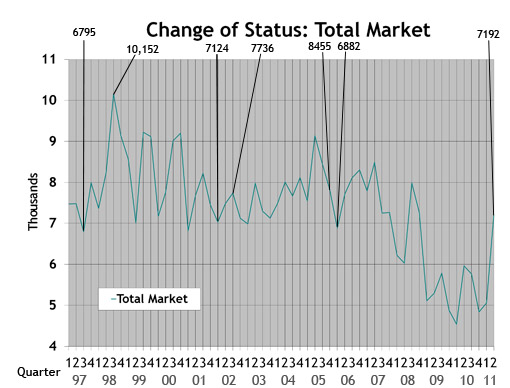 Total Market: Depicts change-of-ownership data for all aircraft included in the Aircraft Bluebook. The numbers are from the FAA Registry. Gliders, homebuilts, airliners and other aircraft not found in the Bluebook are not included in this study.
BUSINESS AIRCRAFT MARKET RECOVERING DESPITE ECONOMIC WOES
Vol. 24, No. 2 | June 6, 2011 | Go to Charts
by Carl Janssens, ASA | Aircraft Bluebook — Price Digest
News networks these days have few positive perceptions when reporting on the U.S. economic recovery. Stories cite home foreclosures, a lack of jobs and the price of gas as prospective signs of a weak economy.
While doubts persist about the United States in an economic recovery, the business aviation sector is not following suit. For instance, late-model, large-cabin, long-range aircraft are selling at or above values published in the Aircraft Bluebook.
While North American business aircraft transactions have been lackluster, increasing sales on other continents are supporting the overall business aircraft market. Whatever the reason, inventories for late-model aircraft for sale continue to shrink. This can be interpreted as an indication of values held in check.
New aircraft models designed and equipped with the latest technology are breathing new life into the industry. Legacy aircraft, on the other hand, will never experience an economic comeback. Darwin’s “survival of the fittest” affects business aircraft, too.
While the U.S. economy still struggles to make a better comeback, business aviation has wheels in the well for the long haul.
Jet
Bluebook-at-a-glance
Increased — 41
Decreased — 298
Stable — 583
Lear 35s are now being reported with MSP, and values trended upward due to the reported equipped price in Bluebook. Late-model Bombardier Global XRSes gained value by $1 million when compared to the previous quarter.
Turboprop
Bluebook-at-a-glance
Increased — 1
Decreased — 93
Stable — 511
Like the rest of the industry, turboprops continued to demonstrate some good signs of stability. Payload, range and cost of operation will be key factors to watch. As competition for commodities becomes more aggressive on a global level, bringing new services to remote regions of the world will also play a role in continued stability in this market segment.
Multi
Bluebook-at-a-glance
Increased — 10
Decreased — 32
Stable — 616
Single
Bluebook-at-a-glance
Increased — 148
Decreased — 335
Stable — 2056
The multi and single markets are some of the best indicators of stability. A majority of these aircraft are represented by personal acquisition. Buyers and sellers agree on price, and financial institutions fund these transactions.
Helicopter
Bluebook-at-a-glance
Increased — 69
Decreased — 122
Stable — 865
The Robinson R44 and R22 gained slightly in value when compared to the previous quarter. The majority of models remained stable for another quarter.
Aircraft Bluebook–Price Digest here for you
Please contact Aircraft Bluebook if you have any specific concern in a particular aircraft market. We will be happy to share with you the most up-to-date information available for your market segment. Call us toll-free at 877-531-1450 or direct at 913-967-1913.
[Go to Charts.]
CHARTS — JUNE 6, 2011
 Used Aircraft Market: This chart displays each model's quarterly value in relationship to its average equipped price at the inception of the aircraft. The study begins in the spring quarter of 1994 and includes the Jet, Turboprop, Multi, Piston and Helicopter. For all charts, the red number indicates the first reporting date after 9-11.
 Jet: The jet chart depicts the average price (in thousands) of the six 1990s jets listed in the box.
 Turboprop: The turboprop chart depicts the average price (in thousands) of a 1985, 1986 and four 1990 turboprops listed in the box.
 Multi: The multi chart depicts the average price (in thousands) of the six multi models listed in the box. Each model’s year will precede the name of the aircraft.
 Piston: The piston chart depicts the average price (in thousands) of the 10 pistons listed in the box. Each model’s year will precede the name of the aircraft.
 Helicopter: The helicopter chart depicts the average price (in thousands) of the six helicopters listed in the box. Each model’s year will precede the name of the aircraft.
 NASDAQ: This ratio scale chart depicts the change for the NASDAQ daily average from quarter to quarter beginning at the end of the first quarter of 1992. Each data point represents the closing daily average on the last trading day of each quarter. This study originates in the first quarter of 1971.
 Aircraft on Registry: The Aircraft on Registry chart depicts the number of aircraft reported in Aircraft Bluebook that are listed on FAA records and considered to be in the U.S. inventory.
 U.S. Real Gross Domestic Product (criteria updated Aug. 27, 2010): This graph represents real gross domestic product measured by the U.S. Bureau of Economic Analysis. Each data point represents the BEA's final figure or latest estimate of the quarter-to-quarter seasonally adjusted annual rates of change in real GDP "based on chained 2005 dollars." The study begins with the second quarter in 2005.
 Single/Multi: The blue line in the Single/Multi chart depicts change-of-ownership data for singles. The black line represents multis.
 Jet/Turboprop/Heli: The black line in the Jet/Turboprop/Heli chart represents change-of-ownership information for jets. The blue line depicts turboprops, and the gray line represents helicopters.
 Total Market: Depicts change-of-ownership data for all aircraft included in the Aircraft Bluebook. The numbers are from the FAA Registry. Gliders, homebuilts, airliners and other aircraft not found in the Bluebook are not included in this study.
USED AIRCRAFT MARKET OFF TO GOOD START IN 2011
Vol. 24, No. 1 | March 8, 2011 | Go to Charts
by Carl Janssens, ASA | Aircraft Bluebook — Price Digest
Have you ever been involved in an incident when you actually made the news?
I have. No, nothing in my life as the editor of Aircraft Bluebook–Price Digest has been particularly newsworthy. But in my previous life as a 25-year veteran in law enforcement with the Kansas City, Mo., Police Department, I sure can relate.
In some cases, my experiences during a particular incident and what I later read in the news about the same incident did not match. Not to knock any journalists for their reporting skills, I am making the point that it is hard to report third-hand information.
Instead of reviewing market statistics to summarize business aircraft activity, I’m going to shoot from the hip, so to speak, and generalize my personal experiences with those I have been in direct contact with who were directly involved with an aircraft transaction.
Business has improved. The only downside to making the deal happen is that the values of yesterday in some aircraft markets are not making a comeback. Breaking it down, late-model, long-range large-cabins are competitive. I can say this because reported values are not skidding downhill. They are holding steady if not improving. Time and condition do impact value.
Looking at the mid-cabin class, sales are also rebounding, but pricing, not so much. Yesterday’s sale price is stronger than today’s. It is what it is.
Light jets and VLJs tell the same story as the mid-cabin class. Turboprops, the muscle of short hops, heavy loads and limited runway environments, are showing a good steady trend of transactions. On the topic of values, what these turboprops are worth today will be a little less tomorrow. If I had to give it a name, I would call it standard depreciation. That alibi will just about work anywhere.
Purchasing piston-powered aircraft is like buying a car. Who in their right mind would buy a new car as an investment? Reported transactions seem to follow my rationalization. I could not find one person who bought a piston-powered aircraft for an investment but plenty who bought for business use and even a few — very few — who bought for personal recreation. No discoveries were noted with values improving, but again, there were plenty of sales.
I have been with the Bluebook for a dozen years now. Reporting on values would be difficult if not for the good support I get from all of you in the trenches making transactions happen. My sincere thanks and gratitude.
Jet
Bluebook-at-a-glance
Increased — 3
Decreased — 534
Stable — 378
Early model Citation Xs were down this quarter. The Citation Mustang gained $100,000 when compared to the winter quarter. The late-model, long-range, large-cabin-class business jets remained stable for yet another quarter. Mid-range cabin business jets were off slightly again this quarter. Check your Bluebook for specifics.
Turboprop
Bluebook-at-a-glance
Increased — 0
Decreased — 70
Stable — 530
The turboprop market displayed little movement in values when compared to the previous quarter. Prices, still softer than previous reporting periods, were not eclipsed by the sales volume of aircraft.
Multi
Bluebook-at-a-glance
Increased — 12
Decreased — 38
Stable — 605
In the multi-engine category, sales reports were better than what Bluebook received for the previous quarter. Quantity was higher while values remained fairly stable.
Single
Bluebook-at-a-glance
Increased — 133
Decreased — 280
Stable — 2095
There was a slight increase in values of the Beechcraft Bonanza 36 series. Reported retail values were slightly higher than the winter Bluebook values. Take a look in the Bluebook to see if your aircraft got the positive bump in value this quarter. Ag piston aircraft values increased this reporting period as well.
Helicopter
Bluebook-at-a-glance
Increased — 33
Decreased — 79
Stable — 942
This market is all about time and condition. Overall, rotary market sales have been nearly the same in the value range when compared to recent Bluebook retail values.
Aircraft Bluebook–Price Digest here for you
Please contact Aircraft Bluebook if you have any specific concern in a particular aircraft market. We will be happy to share with you the most up-to-date information available for your market segment. Call us toll-free at 877-531-1450 or direct at 913-967-1913.
[Go to Charts.]
CHARTS — MARCH 8, 2011
 Used Aircraft Market: This chart displays each model's quarterly value in relationship to its average equipped price at the inception of the aircraft. The study begins in the spring quarter of 1994 and includes the Jet, Turboprop, Multi, Piston and Helicopter. For all charts, the red number indicates the first reporting date after 9-11.
 Jet: The jet chart depicts the average price (in thousands) of the six 1990s jets listed in the box.
 Turboprop: The turboprop chart depicts the average price (in thousands) of a 1985, 1986 and four 1990 turboprops listed in the box.
 Multi: The multi chart depicts the average price (in thousands) of the six multi models listed in the box. Each model’s year will precede the name of the aircraft.
 Piston: The piston chart depicts the average price (in thousands) of the 10 pistons listed in the box. Each model’s year will precede the name of the aircraft.
 Helicopter: The helicopter chart depicts the average price (in thousands) of the six helicopters listed in the box. Each model’s year will precede the name of the aircraft.
 NASDAQ: This ratio scale chart depicts the change for the NASDAQ daily average from quarter to quarter beginning at the end of the first quarter of 1992. Each data point represents the closing daily average on the last trading day of each quarter. This study originates in the first quarter of 1971.
 Aircraft on Registry: The Aircraft on Registry chart depicts the number of aircraft reported in Aircraft Bluebook that are listed on FAA records and considered to be in the U.S. inventory.
 U.S. Real Gross Domestic Product (criteria updated Aug. 27, 2010): This graph represents real gross domestic product measured by the U.S. Bureau of Economic Analysis. Each data point represents the BEA's final figure or latest estimate of the quarter-to-quarter seasonally adjusted annual rates of change in real GDP "based on chained 2005 dollars." The study begins with the second quarter in 2005.
 Single/Multi: The blue line in the Single/Multi chart depicts change-of-ownership data for singles. The black line represents multis.
 Jet/Turboprop/Heli: The black line in the Jet/Turboprop/Heli chart represents change-of-ownership information for jets. The blue line depicts turboprops, and the gray line represents helicopters.
 Total Market: Depicts change-of-ownership data for all aircraft included in the Aircraft Bluebook. The numbers are from the FAA Registry. Gliders, homebuilts, airliners and other aircraft not found in the Bluebook are not included in this study.
 Charts