tagged  Beech, Cessna, Gulfstream, Piper, helicopter, jet, multi, piston, single, turboprop, used aircraft, values in Charts
Charts 


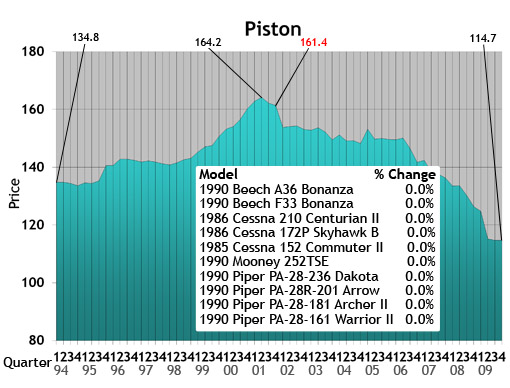
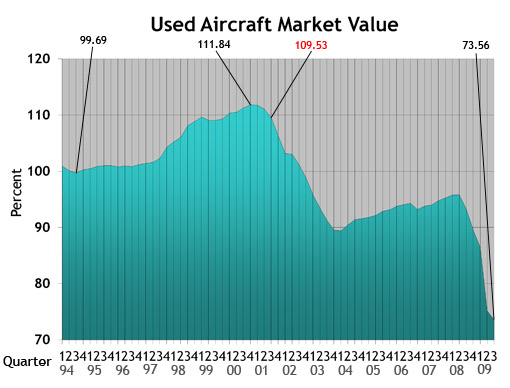
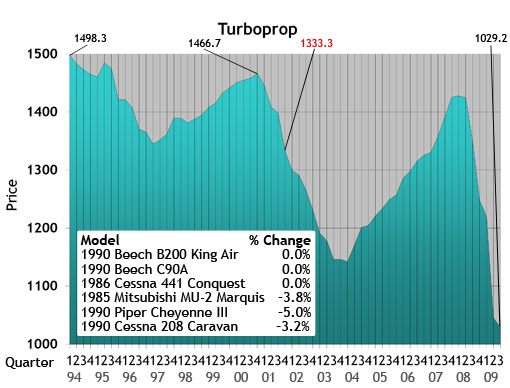
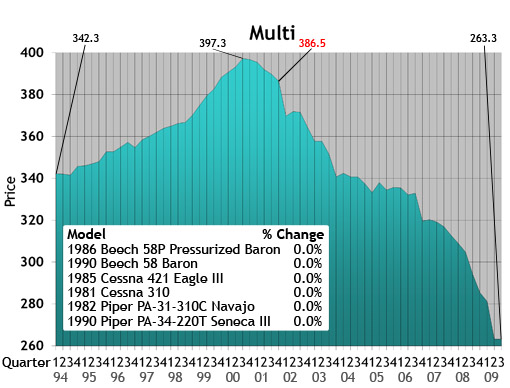
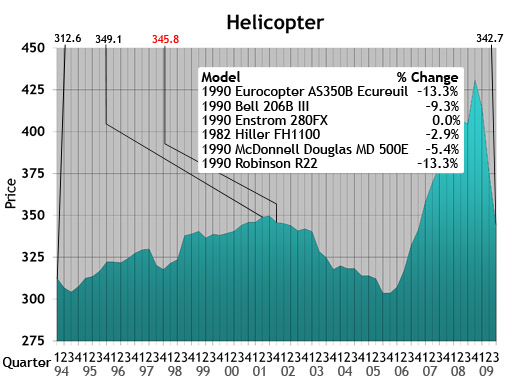
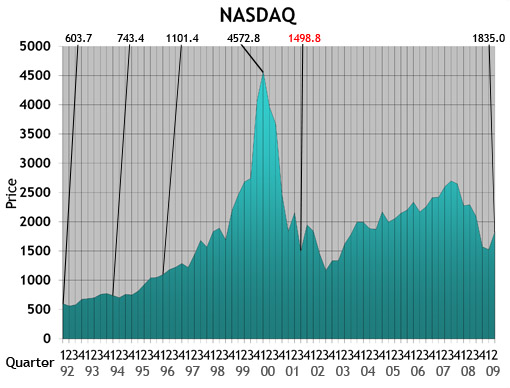
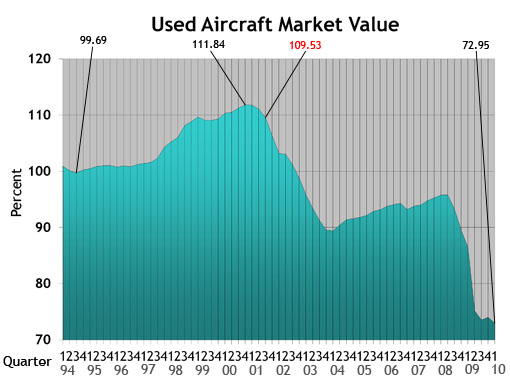 Used Aircraft Market: This chart displays each model's quarterly value in relationship to its average equipped price at the inception of the aircraft. The study begins in the spring quarter of 1994 and includes the Jet, Turboprop, Multi, Piston and Helicopter. For all charts, the red number indicates the first reporting date after 9-11.
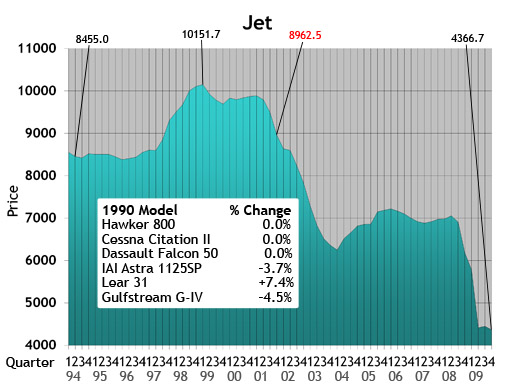
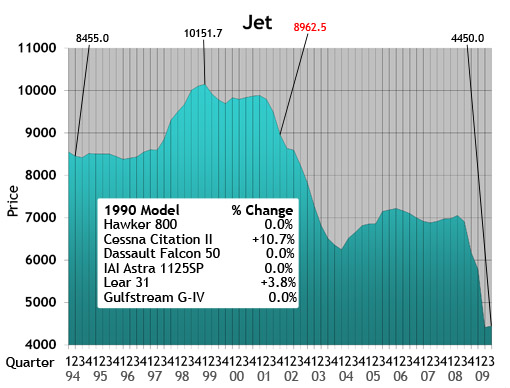
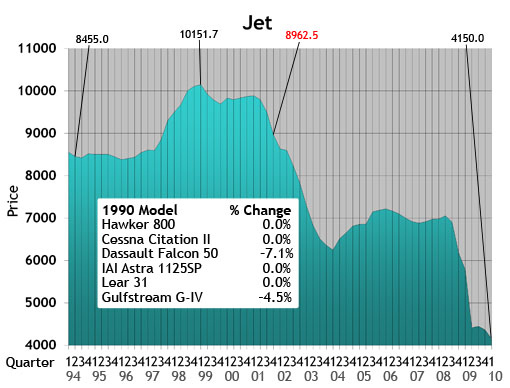 Jet: The jet chart depicts the average price (in thousands) of the six 1990s jets listed in the box.
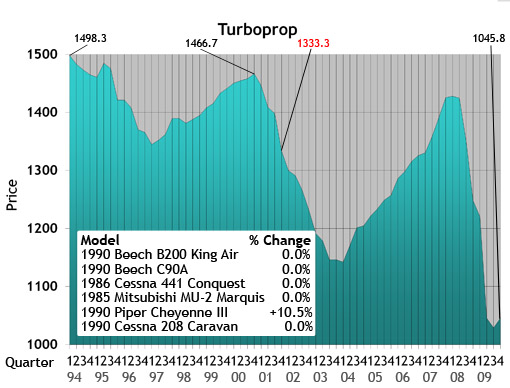
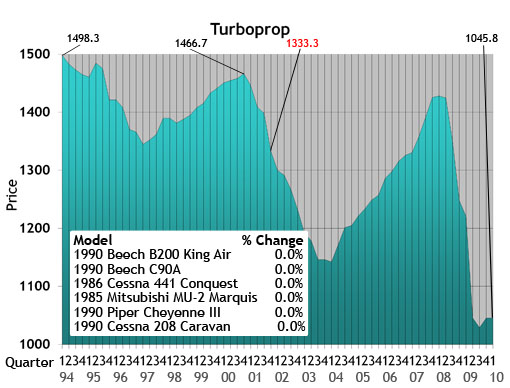 Turboprop: The turboprop chart depicts the average price (in thousands) of a 1985, 1986 and four 1990 turboprops listed in the box.
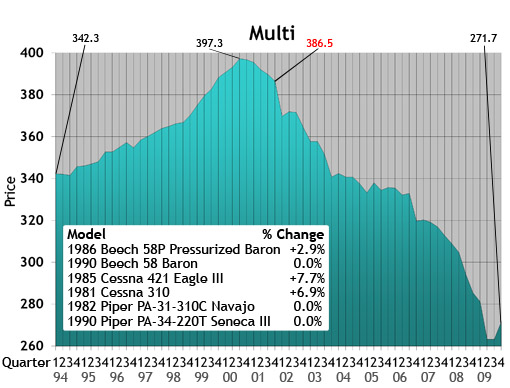
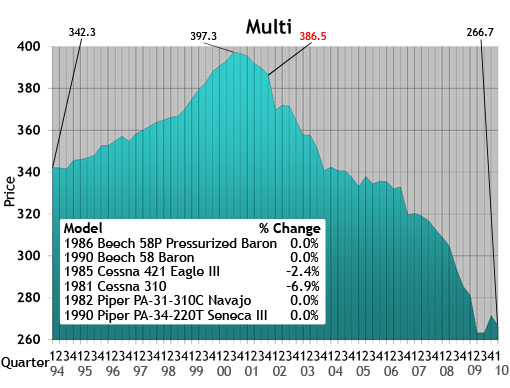 Multi: The multi chart depicts the average price (in thousands) of the six multi models listed in the box. Each model’s year will precede the name of the aircraft.
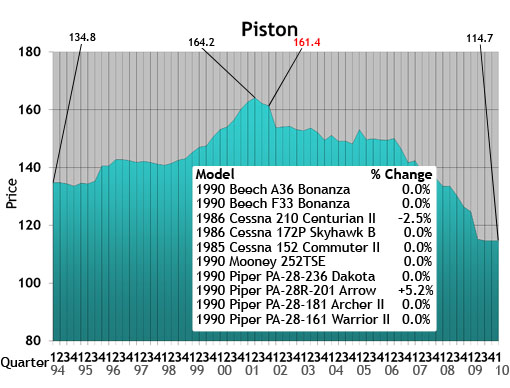 Piston: The piston chart depicts the average price (in thousands) of the 10 pistons listed in the box. Each model’s year will precede the name of the aircraft.
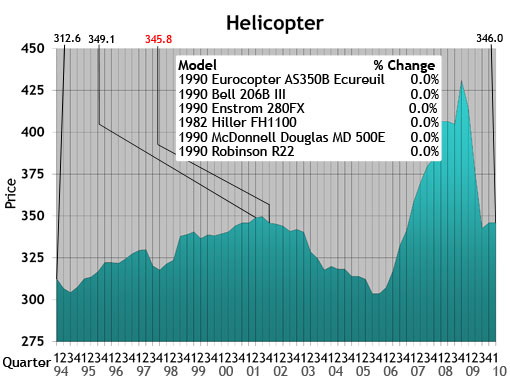 Helicopter: The helicopter chart depicts the average price (in thousands) of the six helicopters listed in the box. Each model’s year will precede the name of the aircraft.
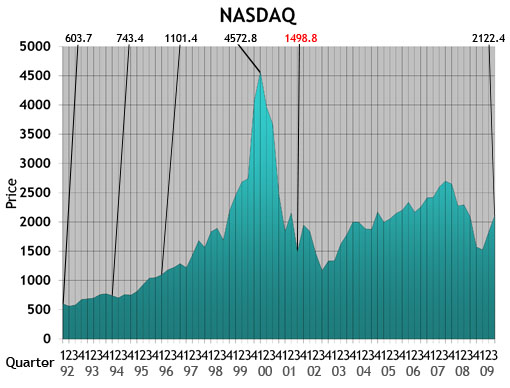
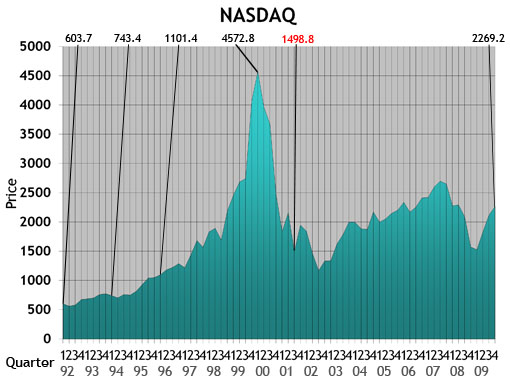 NASDAQ: This ratio scale chart depicts the change for the NASDAQ daily average from quarter to quarter beginning at the end of the first quarter of 1992. Each data point represents the closing daily average on the last trading day of each quarter. This study originates in the first quarter of 1971.
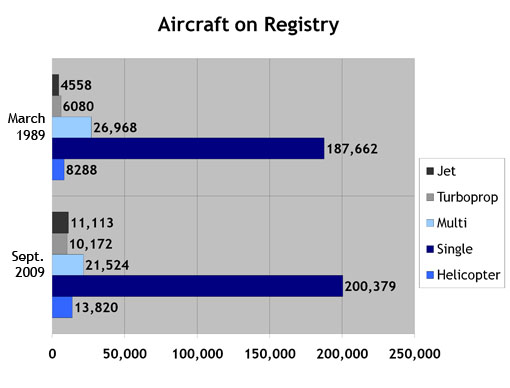
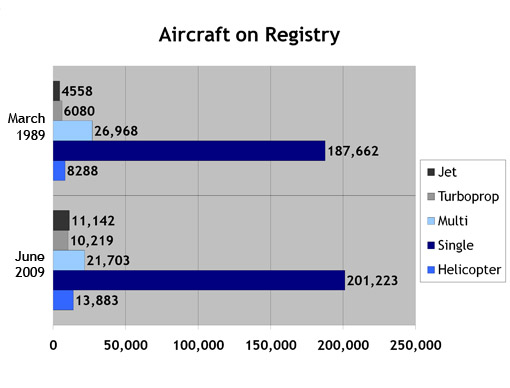
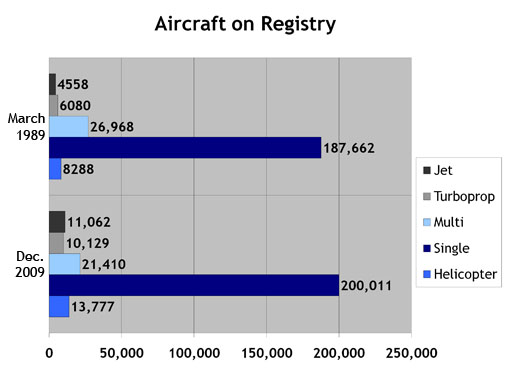 Aircraft on Registry: The Aircraft on Registry chart depicts the number of aircraft reported in Aircraft Bluebook that are listed on FAA records and considered to be in the U.S. inventory.
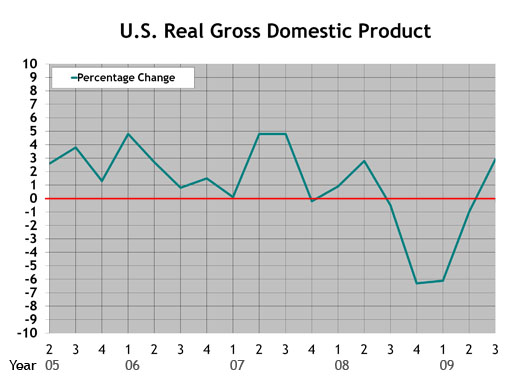
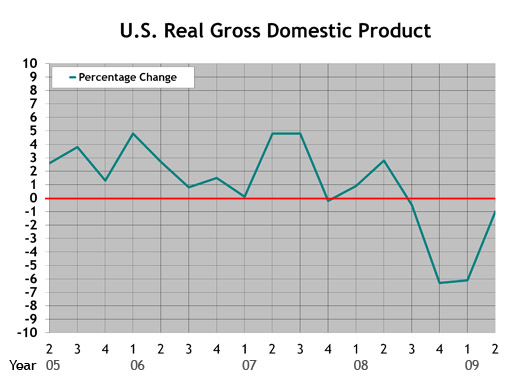
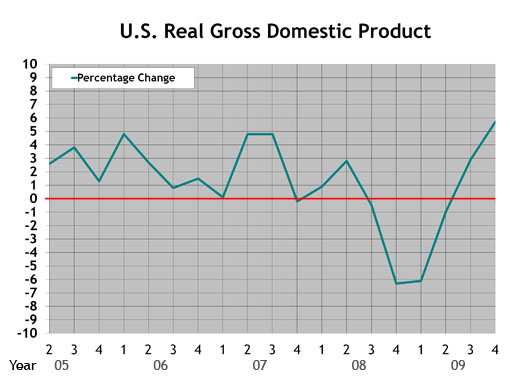 U.S. Real Gross Domestic Product: This graph represents real gross domestic product measured by the U.S. Department of Commerce. Each data point represents the percentage change from the 2005 baseline GDP. The study begins with the second quarter in 2005.
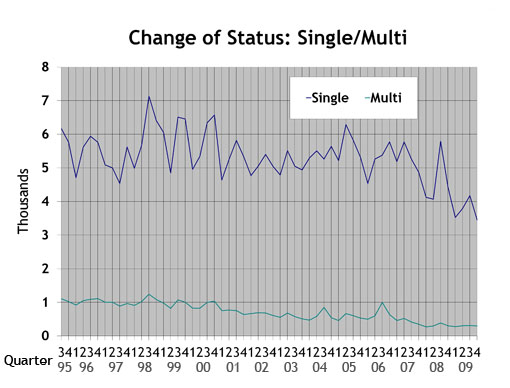 Single/Multi: The blue line in the Single/Multi chart depicts change-of-ownership data for singles. The black line represents multis.
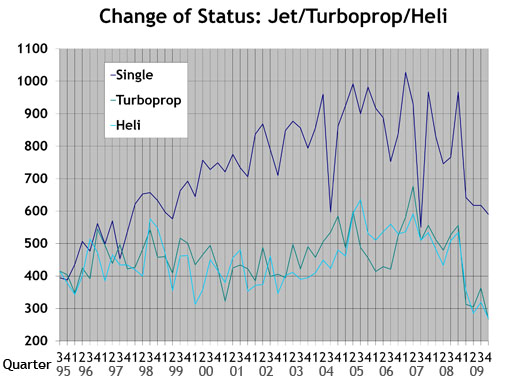 Jet/Turboprop/Heli: The black line in the Jet/Turboprop/Heli chart represents change-of-ownership information for jets. The blue line depicts turboprops, and the gray line represents helicopters.
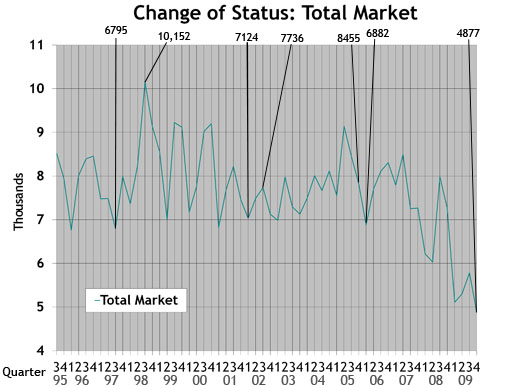 Total Market: Depicts change-of-ownership data for all aircraft included in the Aircraft Bluebook. The numbers are from the FAA Registry. Gliders, homebuilts, airliners and other aircraft not found in the Bluebook are not included in this study.
Charts by Carl Janssens, ASA | Aircraft Bluebook — Price Digest
Entering its home stretch, 2009 certainly has been a forgettable year for general aviation. The losses in value for most owners of corporate aircraft have been significant and, at times, have even been heartbreaking.
However, something is happening out there. While economists predict an economic recovery will be achingly slow, some aircraft values are moving up. The change is barely perceptible and does not apply to every market segment. But inventories are finally contracting instead of expanding, and dealers are again becoming cautiously optimistic.
At the Dubai Airshow, Aircraft Bluebook–Price Digest has witnessed upbeat attitudes.
Aircraft Bluebook was represented in Dubai with its sister publications AC-U-KWIK and The Air Charter Guide. These publications are intricately involved in all aspects of corporate aviation, including aircraft values, FBOs, ground transportation, lodging or a multitude of other support services. At the Dubai Airshow, business was robust. The publications experienced record advertising and book sales.
This trade show in Dubai reflects the health of the international corporate aviation segment. We can hope that the skies over North America will soon host greater numbers of corporate jets giving lift to the companies that use corporate aviation to propel themselves out of these dark times.
While the economy thumbs for a lift, corporate aviation is showing signs of lifting the economy. Remember the National Business Aviation Association and General Aviation Manufacturers Association’s campaign slogan: “No Plane, No Gain.”
Bluebook-at-a-glance
Increased — 46
Decreased — 160
Stable — 652
For large-cabin/long-range aircraft, inventories have firmed with sale prices holding at what should be considered bottom market pricing. The bottom market seekers still waiting for a better opportunity may be surprised when the uptick in values reemerges.
The Lear 31 and Cessna 525 had values in the plus column. The Gulfstream G-IV and Bombardier Challenger 601 experienced minor decreases.
Bluebook-at-a-glance
Increased — 126
Decreased — 11
Stable — 453
Turboprop ag planes continue to demonstrate improved values for yet another quarter. The Piaggio P180 and the family of Piper Cheyennes experienced modest gains. Also in the plus column were the 300 series Beechcraft King Air. Values for select 90 series Beechcraft King Airs were down slightly from the previous quarter. Most aircraft in this category remained stable.
Bluebook-at-a-glance
Increased — 32
Decreased — 37
Stable — 586
Aerostars experienced minor increases in value. The Cessna 421 also demonstrated modest increases when compared to the previous quarter. The Beech Duke and Cessna 414 values were down slightly. Most values reflected no change.
Bluebook-at-a-glance
Increased — 132
Decreased — 108
Stable — 2209
Ag planes kept a positive note for another quarter. The Cirrus SR20 also improved modestly in select model years. For the most part, the majority of single-engine piston aircraft held steady. Decreases in value were minimal. Select Mooneys were down a few thousand dollars.
Bluebook-at-a-glance
Increased — 62
Decreased — 170
Stable — 770
The helicopter markets reported in Bluebook appear to be leveling off as well. Most models were stable for the reporting quarter. Eurocopter Twin Stars as well as the Bell 206 series were up slightly. Some values declining for this quarter include the Eurocopter AS350 and the Bell 430.
Please contact Aircraft Bluebook if you have any specific concern in a particular aircraft market. We will be happy to share with you the most up-to-date information available for your market segment. Call us at 877-531-1450 or 913-967-1913.
Newsletter 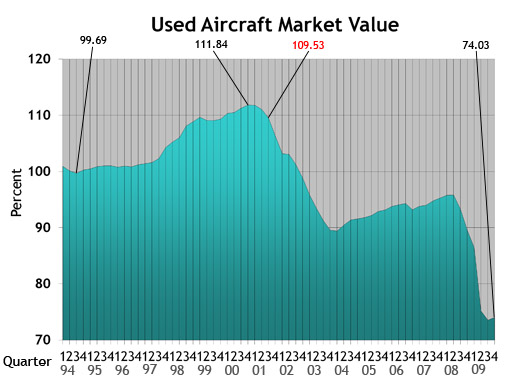 Used Aircraft Market: This chart displays each model's quarterly value in relationship to its average equipped price at the inception of the aircraft. The study begins in the spring quarter of 1994 and includes the Jet, Turboprop, Multi, Piston and Helicopter. For all charts, the red number indicates the first reporting date after 9-11.
 Jet: The jet chart depicts the average price (in thousands) of the six 1990s jets listed in the box.
 Turboprop: The turboprop chart depicts the average price (in thousands) of a 1985, 1986 and four 1990 turboprops listed in the box.
 Multi: The multi chart depicts the average price (in thousands) of the six multi models listed in the box. Each model’s year will precede the name of the aircraft.
 Piston: The piston chart depicts the average price (in thousands) of the 10 pistons listed in the box. Each model’s year will precede the name of the aircraft.
 Helicopter: The helicopter chart depicts the average price (in thousands) of the six helicopters listed in the box. Each model’s year will precede the name of the aircraft.
 NASDAQ: This ratio scale chart depicts the change for the NASDAQ daily average from quarter to quarter beginning at the end of the first quarter of 1992. Each data point represents the closing daily average on the last trading day of each quarter. This study originates in the first quarter of 1971.
 Aircraft on Registry: The Aircraft on Registry chart depicts the number of aircraft reported in Aircraft Bluebook that are listed on FAA records and considered to be in the U.S. inventory.
 U.S. Real Gross Domestic Product: This graph represents real gross domestic product measured by the U.S. Department of Commerce. Each data point represents the percentage change from the 2005 baseline GDP. The study begins with the second quarter in 2005.
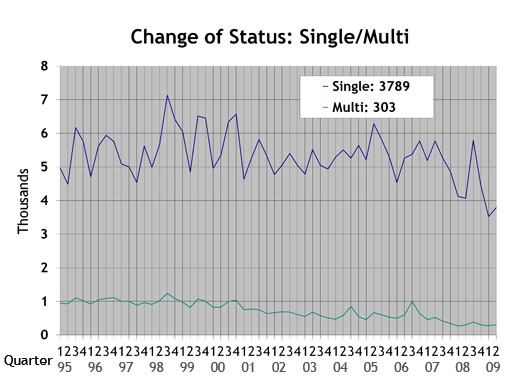
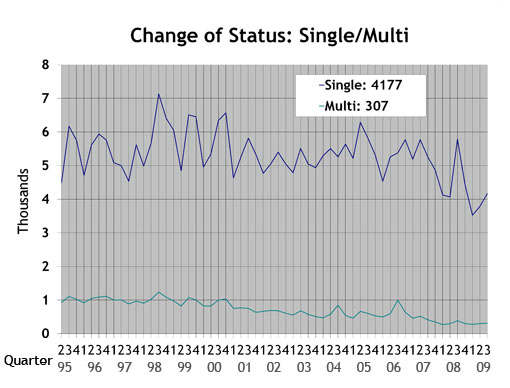 Single/Multi: The blue line in the Single/Multi chart depicts change-of-status data for singles. The green line represents multis.
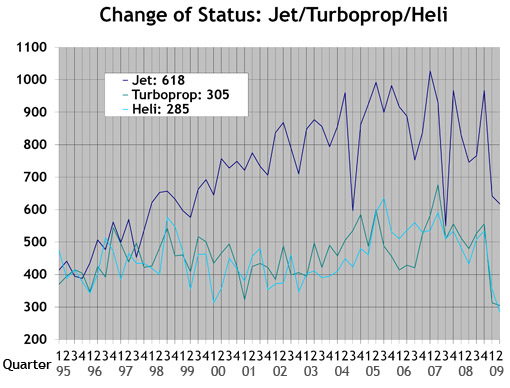
 Jet/Turboprop/Heli: The dark blue line in the Jet/Turboprop/Heli chart represents change-of-status information for jets. The green line depicts turboprops, and the light blue line represents helicopters.
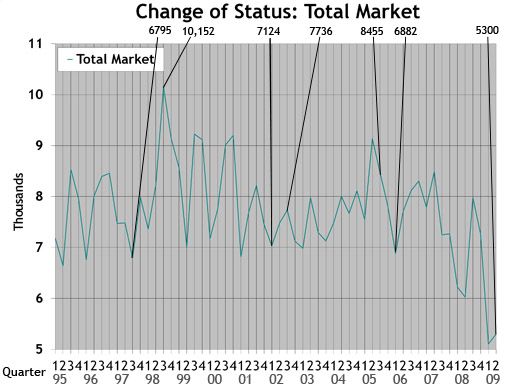
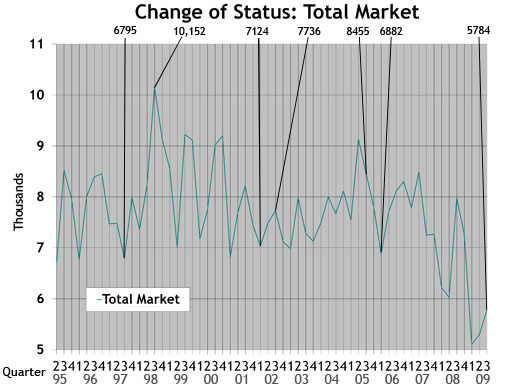 Total Market: Depicts change-of-status data for all aircraft included in the Aircraft Bluebook. The numbers are from the FAA Registry. Gliders, homebuilts, airliners and other aircraft not found in the Bluebook are not included in this study.
by Carl Janssens, ASA | Aircraft Bluebook — Price Digest
Aircraft values reported in the previous quarter were in a spiral dive, but the economy’s pilot now appears to have neutralized the rapid descent.
For the most part, values have arrived at ground level. Inventories have shown signs of stability with little or no growth in units for sale. Other market indicators show signs of neutralization as well. Aircraft dealers and brokers report that interest has increased. Phones are ringing more with potential buyers on the line. Compared to the 2005 baseline real gross domestic product, GDP declined 1.0 percent in the second quarter of 2009 after declining 6.4 percent in the first quarter. These indicators support the signs of neutralization in the marketplace, though the used aircraft market has no reason to rally.
Maybe the market has not yet reached the dawn of a recovery, but the market has absorbed the fallen values. The jet segment is the most volatile portion of the aircraft market. Flight departments that were liquidated are no longer creating a frenzy of drastic value reductions. Manufacturers finding new homes for new aircraft in default maintain nearly full sales values. The only difference is that deposits from contracts in default allow discounts to the new buyers. Once these sales are complete, the discounts will end.
Bluebook-at-a-glance
Increased — 143
Decreased — 49
Stable — 665
Bluebook’s attention has focused on late-model large-cabin new deliveries that may take as long as two years or more for interior completion and delivery. Some of the increase in value can be found in the fall edition of Aircraft Bluebook. Examples include the Bombardier Global family as well as the Challenger 605 and Dassault Falcon 900 and 2000 series.
Bluebook-at-a-glance
Increased — 75
Decreased — 114
Stable — 399
Socata fared better in this reporting period. Sales demonstrated that values were better than previously reported; therefore, stronger values appear in the new release of Bluebook. Turboprop ag planes continue to demonstrate improved values with limited inventories available in the world market. The Piaggio was up 9 percent from the previous quarter as well.
Bluebook-at-a-glance
Increased — 0
Decreased — 110
Stable — 545
For the most part, values remained unchanged for this reporting period in the multipiston category. Nothing increased in value. Most late models held on to their values without loss. Early model Cessnas as well as some Twin Commanders trended downward slightly.
Bluebook-at-a-glance
Increased — 117
Decreased — 220
Stable — 2108
Ag planes kept a positive note in the single category. Select models experienced modest increases. Some of the decreases included American Champions, such as the 8-KCAB, and Beech 35. Both were reported down from the previous quarter. For the most part, however, most single-engine pistons remained steady for this reporting period.
Bluebook-at-a-glance
Increased — 4
Decreased — 828
Stable — 177
Helicopter values experienced a decline in this quarter. Part of the decline may relate to lower values on earlier models with limited mission capabilities when compared to newer helicopters. Early-model Sikorsky aircraft as well as Bell and Eurocopter models were down. Decreases averaged 8 percent or more. In the piston category, values were lower, too.
Please contact Aircraft Bluebook if you have any specific concern in a particular aircraft market. We will be happy to share with you the most up-to-date information available for your market segment. Call us toll free at 877-531-1450 or direct at 913-967-1913.
 Used Aircraft Market: This chart displays each model's quarterly value in relationship to its average equipped price at the inception of the aircraft. The study begins in the spring quarter of 1994 and includes the Jet, Turboprop, Multi, Piston and Helicopter. For all charts, the red number indicates the first reporting date after 9-11.
 Jet: The jet chart depicts the average price (in thousands) of the six 1990s jets listed in the box.
 Turboprop: The turboprop chart depicts the average price (in thousands) of a 1985, 1986 and four 1990 turboprops listed in the box.
 Multi: The multi chart depicts the average price (in thousands) of the six multi models listed in the box. Each model’s year will precede the name of the aircraft.
 Piston: The piston chart depicts the average price (in thousands) of the 10 pistons listed in the box. Each model’s year will precede the name of the aircraft.
 Helicopter: The helicopter chart depicts the average price (in thousands) of the six helicopters listed in the box. Each model’s year will precede the name of the aircraft.
 NASDAQ: This ratio scale chart depicts the change for the NASDAQ daily average from quarter to quarter beginning at the end of the first quarter of 1992. Each data point represents the closing daily average on the last trading day of each quarter. This study originates in the first quarter of 1971.
 Aircraft on Registry: The Aircraft on Registry chart depicts the number of aircraft reported in Aircraft Bluebook that are listed on FAA records and considered to be in the U.S. inventory.
 U.S. Real Gross Domestic Product: This graph represents real gross domestic product measured by the U.S. Department of Commerce. Each data point represents the percentage change from the 2005 baseline GDP. The study begins with the second quarter in 2005.
 Single/Multi: The blue line in the Single/Multi chart depicts change-of-status data for singles. The green line represents multis.
 Jet/Turboprop/Heli: The dark blue line in the Jet/Turboprop/Heli chart represents change-of-status information for jets. The green line depicts turboprops, and the light blue line represents helicopters.
 Total Market: Depicts change-of-status data for all aircraft included in the Aircraft Bluebook. The numbers are from the FAA Registry. Gliders, homebuilts, airliners and other aircraft not found in the Bluebook are not included in this study.