


Entries in Dassault Falcon 50 (4)
CHARTS — SEPT. 13, 2011
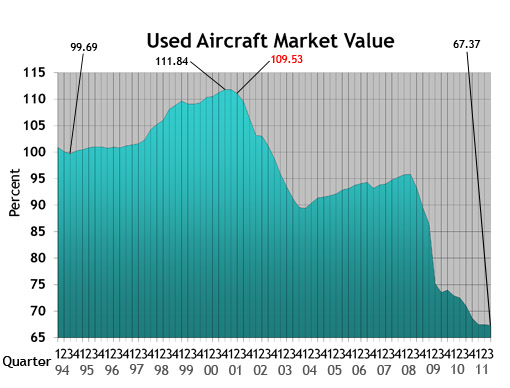 Used Aircraft Market: This chart displays each model's quarterly value in relationship to its average equipped price at the inception of the aircraft. The study begins in the spring quarter of 1994 and includes the Jet, Turboprop, Multi, Piston and Helicopter. For all charts, the red number indicates the first reporting date after 9-11.
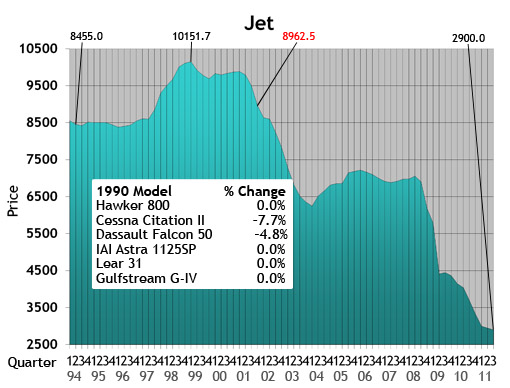 Jet: The jet chart depicts the average price (in thousands) of the six 1990s jets listed in the box.
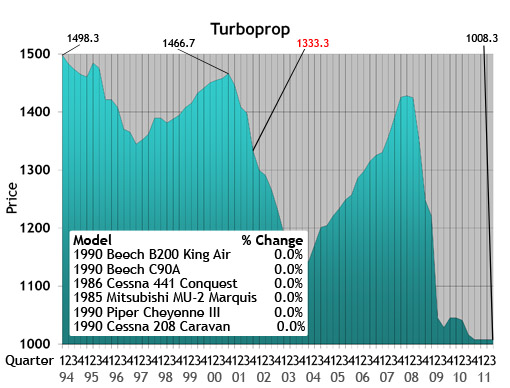 Turboprop: The turboprop chart depicts the average price (in thousands) of a 1985, 1986 and four 1990 turboprops listed in the box.
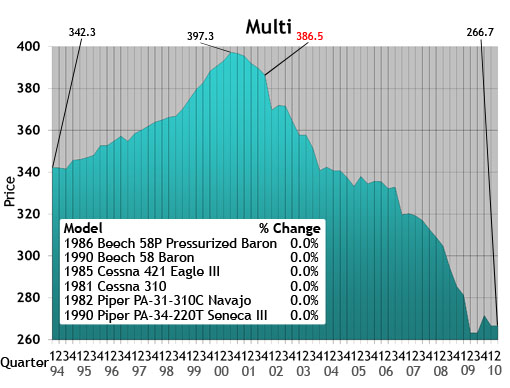
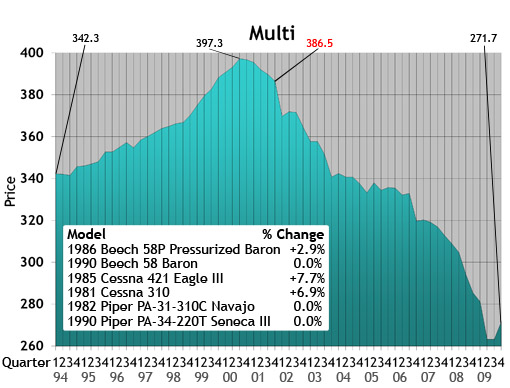
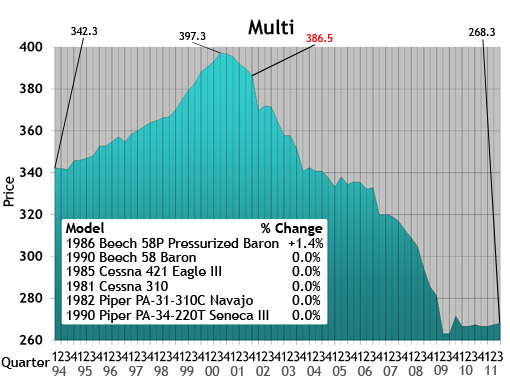 Multi: The multi chart depicts the average price (in thousands) of the six multi models listed in the box. Each model’s year will precede the name of the aircraft.
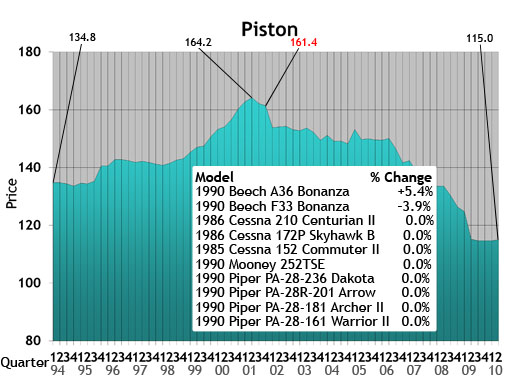
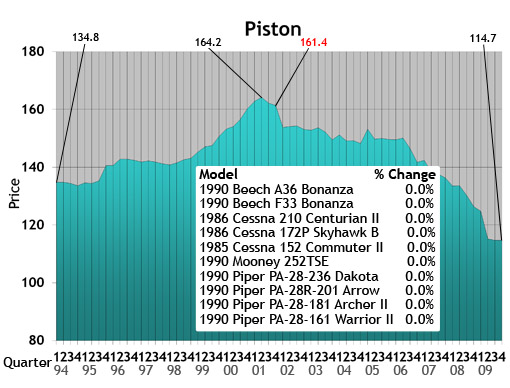
 Piston: The piston chart depicts the average price (in thousands) of the 10 pistons listed in the box. Each model’s year will precede the name of the aircraft.
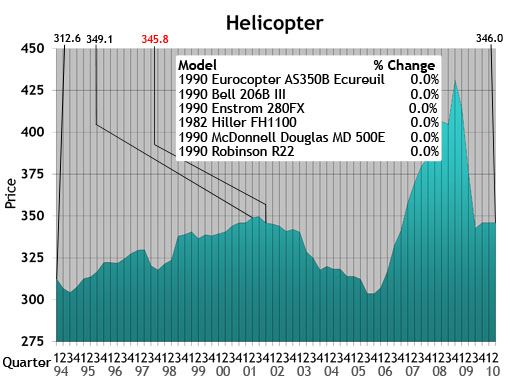
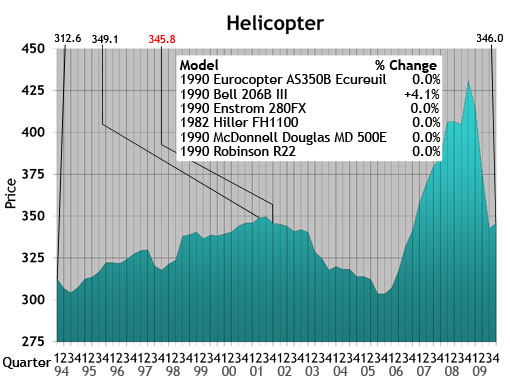
 Helicopter: The helicopter chart depicts the average price (in thousands) of the six helicopters listed in the box. Each model’s year will precede the name of the aircraft.
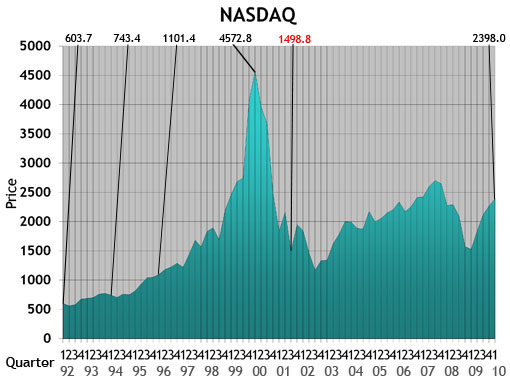
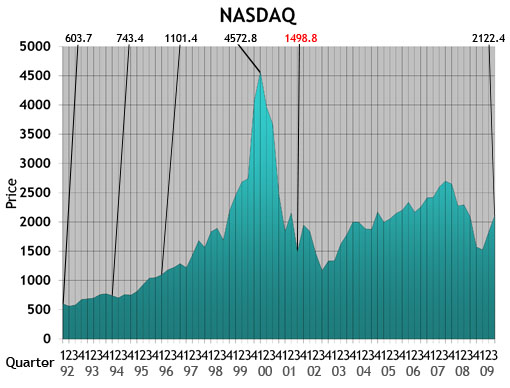
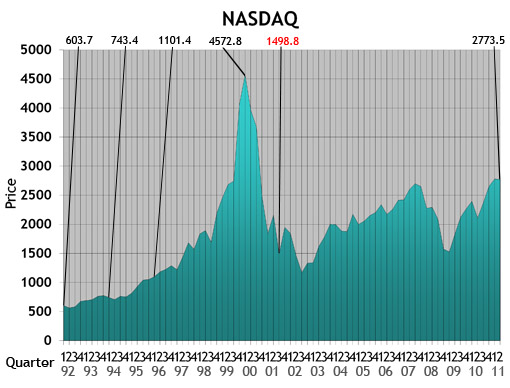 NASDAQ: This ratio scale chart depicts the change for the NASDAQ daily average from quarter to quarter beginning at the end of the first quarter of 1992. Each data point represents the closing daily average on the last trading day of each quarter. This study originates in the first quarter of 1971.
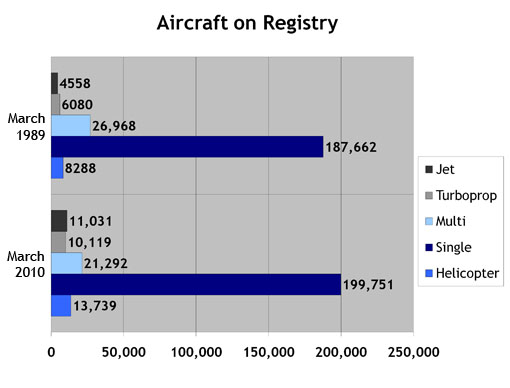
 Aircraft on Registry: The Aircraft on Registry chart depicts the number of aircraft reported in Aircraft Bluebook that are listed on FAA records and considered to be in the U.S. inventory.
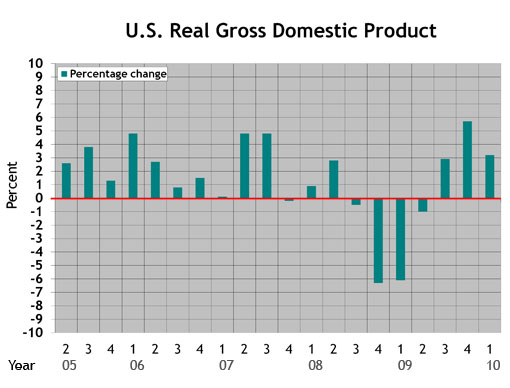
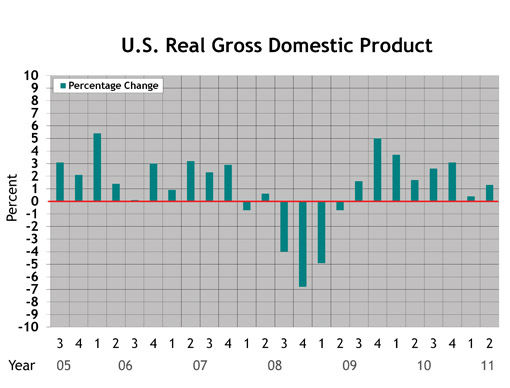 U.S. Real Gross Domestic Product (criteria updated Aug. 27, 2010): This graph represents real gross domestic product measured by the U.S. Bureau of Economic Analysis. Each data point represents the BEA's final figure or latest estimate of the quarter-to-quarter seasonally adjusted annual rates of change in real GDP "based on chained 2005 dollars." The study begins with the second quarter in 2005.
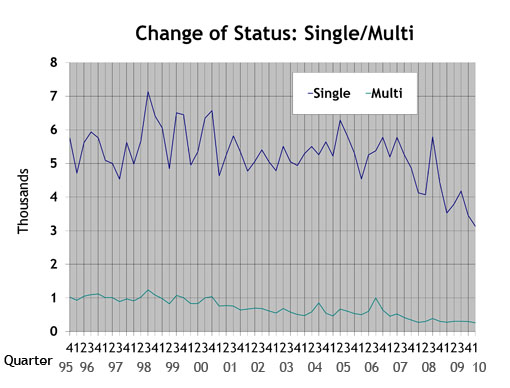
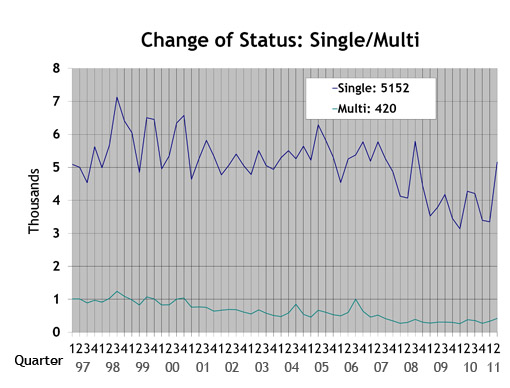 Single/Multi: The blue line in the Single/Multi chart depicts change-of-ownership data for singles. The black line represents multis.
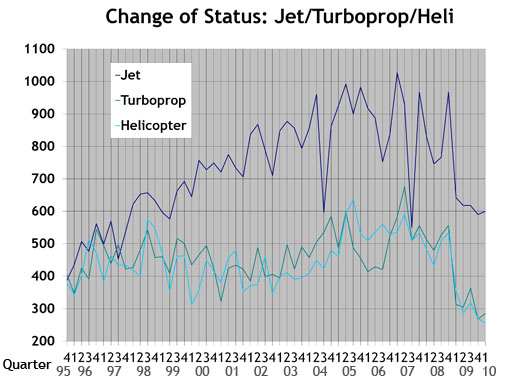
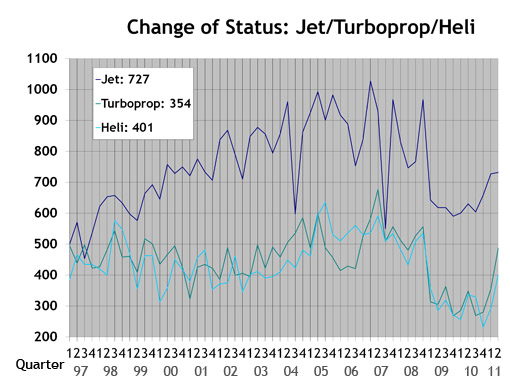 Jet/Turboprop/Heli: The black line in the Jet/Turboprop/Heli chart represents change-of-ownership information for jets. The blue line depicts turboprops, and the gray line represents helicopters.
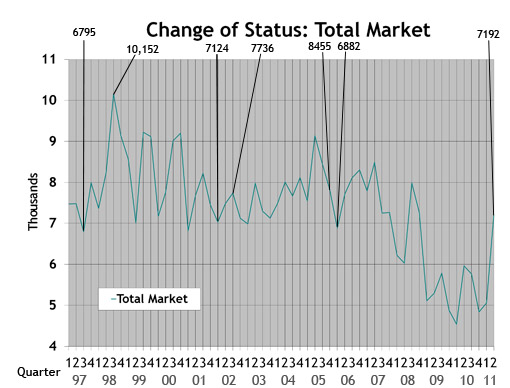 Total Market: Depicts change-of-ownership data for all aircraft included in the Aircraft Bluebook. The numbers are from the FAA Registry. Gliders, homebuilts, airliners and other aircraft not found in the Bluebook are not included in this study.
 Aircraft Bluebook Marketline
CHARTS — MAY 26, 2010
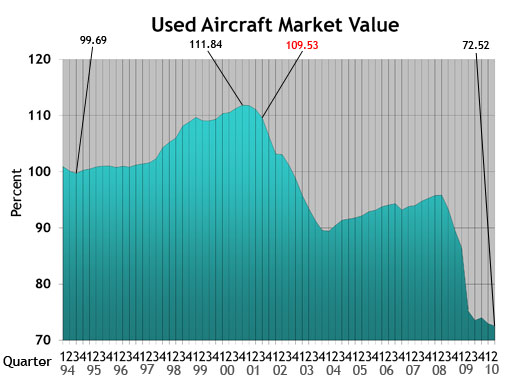 Used Aircraft Market: This chart displays each model's quarterly value in relationship to its average equipped price at the inception of the aircraft. The study begins in the spring quarter of 1994 and includes the Jet, Turboprop, Multi, Piston and Helicopter. For all charts, the red number indicates the first reporting date after 9-11.
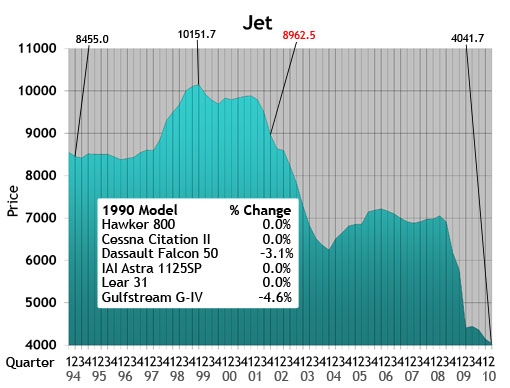 Jet: The jet chart depicts the average price (in thousands) of the six 1990s jets listed in the box.
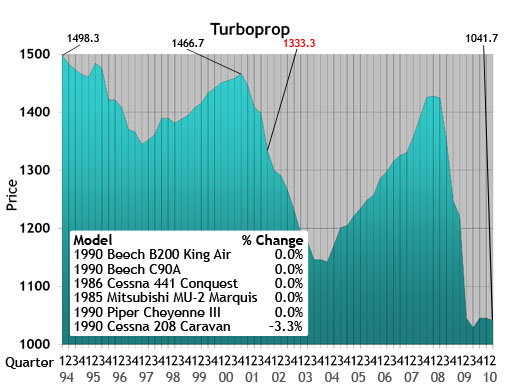 Turboprop: The turboprop chart depicts the average price (in thousands) of a 1985, 1986 and four 1990 turboprops listed in the box.
 Multi: The multi chart depicts the average price (in thousands) of the six multi models listed in the box. Each model’s year will precede the name of the aircraft.
 Piston: The piston chart depicts the average price (in thousands) of the 10 pistons listed in the box. Each model’s year will precede the name of the aircraft.
 Helicopter: The helicopter chart depicts the average price (in thousands) of the six helicopters listed in the box. Each model’s year will precede the name of the aircraft.
 NASDAQ: This ratio scale chart depicts the change for the NASDAQ daily average from quarter to quarter beginning at the end of the first quarter of 1992. Each data point represents the closing daily average on the last trading day of each quarter. This study originates in the first quarter of 1971.
 Aircraft on Registry: The Aircraft on Registry chart depicts the number of aircraft reported in Aircraft Bluebook that are listed on FAA records and considered to be in the U.S. inventory.
 U.S. Real Gross Domestic Product: This graph represents real gross domestic product measured by the U.S. Department of Commerce. Each data point represents the percentage change from the 2005 baseline GDP. The study begins with the second quarter in 2005.
 Single/Multi: The blue line in the Single/Multi chart depicts change-of-ownership data for singles. The black line represents multis.
 Jet/Turboprop/Heli: The black line in the Jet/Turboprop/Heli chart represents change-of-ownership information for jets. The blue line depicts turboprops, and the gray line represents helicopters.
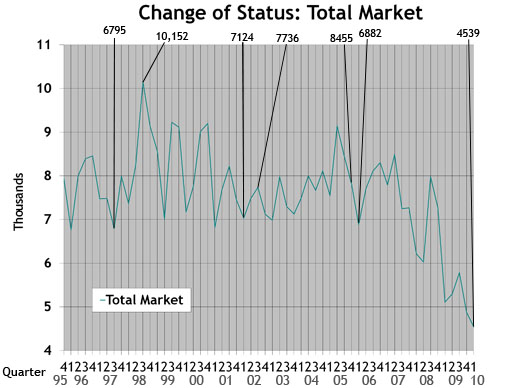 Total Market: Depicts change-of-ownership data for all aircraft included in the Aircraft Bluebook. The numbers are from the FAA Registry. Gliders, homebuilts, airliners and other aircraft not found in the Bluebook are not included in this study.
PRE-OWNED AIRCRAFT MARKET DISTRACTED BY BOTTOM FEEDERS
Vol. 23, No. 1 | Feb. 17, 2010 | Go to Charts
by Carl Janssens, ASA | Aircraft Bluebook — Price Digest
In the pre-owned aircraft market, bottom feeders are like red herrings.
Bottom feeders — corporate aircraft that have no significant issues with their history, maintenance or condition and are marketed below Bluebook wholesale values — continue to be great opportunities for the fortunate few who buy without a blink of an eye.
They also lead buyers into a false perception of value that only competition in the market can correct.
Reasons why such aggressive marketing maneuvers continue to appear are wide and varied. When a corporate aircraft with no issues with its condition, equipment or history sells for a low price, Aircraft Bluebook–Price Digest investigates to learn the whole story. Capital gains, tax shelters, foreclosures, and even new deliveries are just a few reasons behind these significantly discounted offerings. One common denominator in all of this is the element of time. An aggressive discount in price represents interest in an immediate sale. True, this moves the economy, but such a transaction does not fit the definition of Fair Market, which the Bluebook reports as Average Retail.
Pre-owned aircraft sales activity slowly is showing stability in the market, but news of another bottom feeder eclipses these transactions, and market perception has to be rebooted like after a computer crash.
Serious buyers are starting to see beyond all the drama when an unrealistic offering is being denied by the seller. Ready-to-fly, well-equipped aircraft with fresh maintenance are bringing some normalcy to aircraft values.
Although the market is still nothing to brag about, and trends still might adjust down, this market is nothing like the roller coaster ride of 2009. As the market slowly improves, attention to navigating through the economy is migrating from ground to traffic awareness.
Jet
Bluebook-at-a-glance
Increased — 2
Decreased — 455
Stable — 419
Late-model, large-cabin aircraft are retaining value. Don’t be surprised if supply and demand create more competition between buyers. This competition will start a slow upward tick in pricing. Now is really the time to buy in this market.
Citation X values remained steady while the Sovereign was off 2 percent from last quarter. Bombardier Global Express and the 5000 remained steady while the Challenger 604 declined 2.5 percent. The Falcon 7X held steady while the Falcon 50 was down 5 percent from last quarter. Late-model Gulfstreams held steady while earlier models were off 5 percent from the winter Bluebook.
Turboprop
Bluebook-at-a-glance
Increased — 13
Decreased — 62
Stable — 518
The ag market continued to show no changes in value when compared to the previous quarter. Late-model King Airs remained stable while earlier models generally also held on without trending. The Cessna Caravan was stable with later models down 1 percent or less. Some slight rays of sunshine were select Piper Cheyennes experiencing slight increases from the previous quarter.
Multi
Bluebook-at-a-glance
Increased — 30
Decreased — 105
Stable — 521
For the most part, late-model twins, the Beech Baron and Piper Seneca held steady for yet another quarter. Early-model twins such as the Cessna 421 and Beech Duke were off 2 percent from the winter Bluebook.
Single
Bluebook-at-a-glance
Increased — 272
Decreased — 618
Stable — 1581
Ag planes generally remained unchanged. Amphibious models such as the Lake were up slightly in trending. The Piper Arrow was also in the positive column while most Maules were off slightly. Late-model Bonanzas and Cessna singles held steady while the Diamond Star was up 5 percent or more. For the most part, values remained steady.
Helicopter
Bluebook-at-a-glance
Increased — 13
Decreased — 99
Stable — 904
Helicopter models reported in Bluebook continue to level off. Piston helicopters such as Enstrom and Robinson were up slightly through select model years. Some turbines, such as the Eurocopter EC135, were off 5 percent from the previous quarter. Overall, the majority of models reported in Bluebook remained stable.
Aircraft Bluebook–Price Digest here for you
Please contact Aircraft Bluebook if you have any specific concern in a particular aircraft market. We will be happy to share with you the most up-to-date information available for your market segment. Call us toll-free at 877-531-1450 or direct at 913-967-1913.
[Go to Charts.]
CHARTS — NOV. 30, 2009
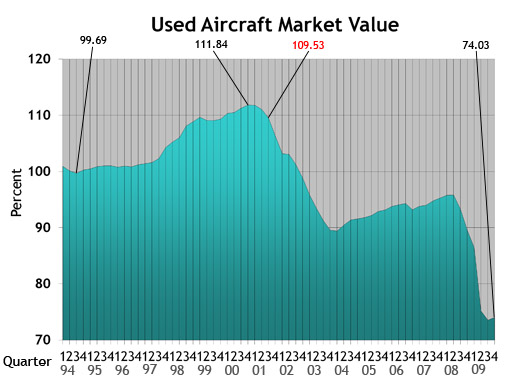 Used Aircraft Market: This chart displays each model's quarterly value in relationship to its average equipped price at the inception of the aircraft. The study begins in the spring quarter of 1994 and includes the Jet, Turboprop, Multi, Piston and Helicopter. For all charts, the red number indicates the first reporting date after 9-11.
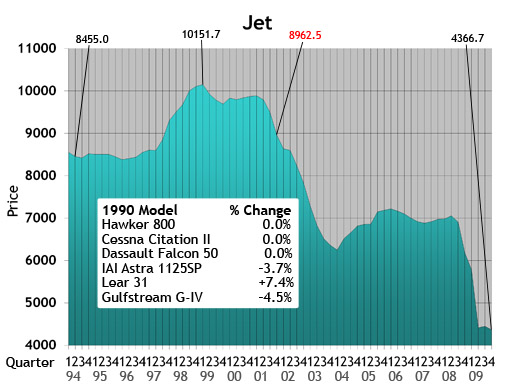 Jet: The jet chart depicts the average price (in thousands) of the six 1990s jets listed in the box.
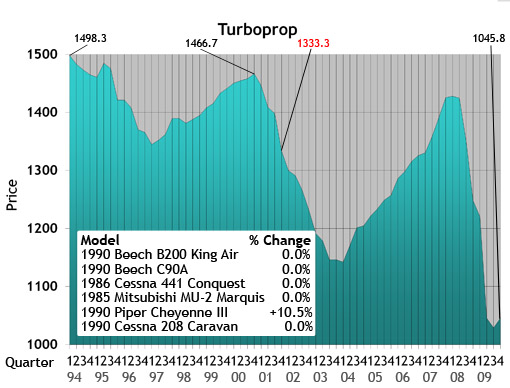 Turboprop: The turboprop chart depicts the average price (in thousands) of a 1985, 1986 and four 1990 turboprops listed in the box.
 Multi: The multi chart depicts the average price (in thousands) of the six multi models listed in the box. Each model’s year will precede the name of the aircraft.
 Piston: The piston chart depicts the average price (in thousands) of the 10 pistons listed in the box. Each model’s year will precede the name of the aircraft.
 Helicopter: The helicopter chart depicts the average price (in thousands) of the six helicopters listed in the box. Each model’s year will precede the name of the aircraft.
 NASDAQ: This ratio scale chart depicts the change for the NASDAQ daily average from quarter to quarter beginning at the end of the first quarter of 1992. Each data point represents the closing daily average on the last trading day of each quarter. This study originates in the first quarter of 1971.
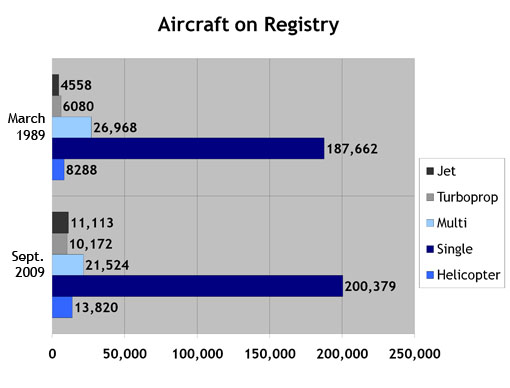 Aircraft on Registry: The Aircraft on Registry chart depicts the number of aircraft reported in Aircraft Bluebook that are listed on FAA records and considered to be in the U.S. inventory.
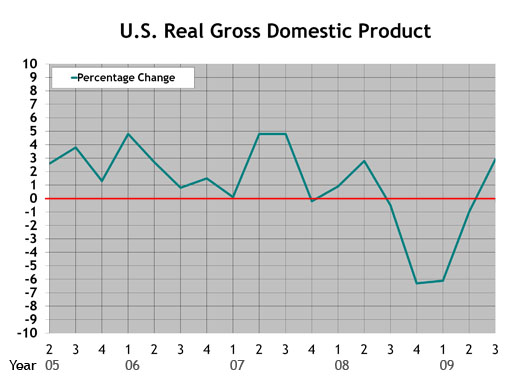 U.S. Real Gross Domestic Product: This graph represents real gross domestic product measured by the U.S. Department of Commerce. Each data point represents the percentage change from the 2005 baseline GDP. The study begins with the second quarter in 2005.
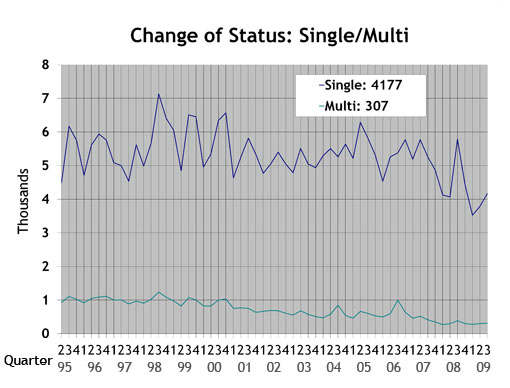 Single/Multi: The blue line in the Single/Multi chart depicts change-of-status data for singles. The green line represents multis.
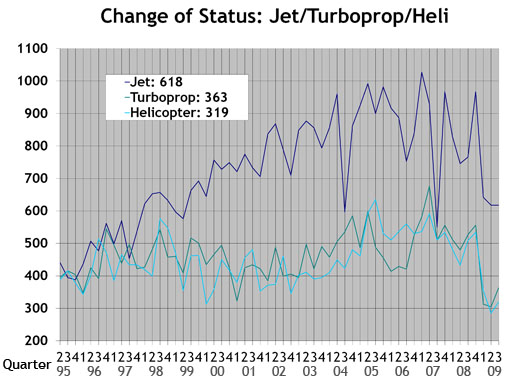 Jet/Turboprop/Heli: The dark blue line in the Jet/Turboprop/Heli chart represents change-of-status information for jets. The green line depicts turboprops, and the light blue line represents helicopters.
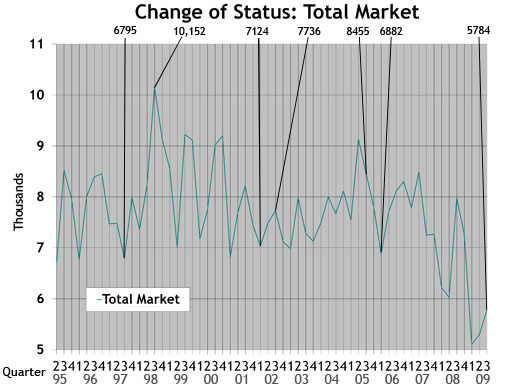 Total Market: Depicts change-of-status data for all aircraft included in the Aircraft Bluebook. The numbers are from the FAA Registry. Gliders, homebuilts, airliners and other aircraft not found in the Bluebook are not included in this study.