


tagged  Market Conditions, aircraft inventory, deliveries, economy


Entries in economy (4)
Market Conditions and Inventory
By Dennis Rousseau | President and Founder | AircraftPost

Over the last couple months, we’ve heard many perspectives, and in some cases hyperbole, on market conditions and inventory, most leaning in the direction of too few aircraft on the market and those that are available are too old, new, high priced, wrong equipment, color, etc. Before delving into this further, perhaps it’s prudent to mention that prior to an economic downturn, our markets do in fact act erratically. As of July 2019, the US economic expansion is now the longest on record, entering its 121st month since the end of the 2009 recession and surpassing the previous 120-month record that ended with the dot com bust. Conversely, the majority of financial indices are pointing in the direction of a global recession toward the end of this year and there are many countries currently feeling the contraction. China, Japan, Germany, UK, Taiwan, S Korea, Italy and Russia are some of the countries currently experiencing a downturn. Could this have an impact on business jet transactions? Absolutely.
In terms of new aircraft deliveries, the height of the market was in 2015 when 563 new business jets entered service, almost double the 203 delivered in 2010. Fast forward and new aircraft deliveries have waned, dropping 13% in just 3 years. In the first 6-months of 2019 we’ve seen 230 new business jet deliveries and even IF sales and production continued on track for the year...
PRE-OWNED AIRCRAFT TRANSACTIONS INCREASE WHILE VALUES DECREASE
Vol. 23, No. 3 | Aug. 18, 2010 | Go to Charts
by Carl Janssens, ASA | Aircraft Bluebook — Price Digest
There should be some optimism in our industry.
Buyers and sellers are finally coming to terms with what the market will bear for a given aircraft. And with that, the pre-owned aircraft market is seeing more completed deals. The gridlock of available inventory is starting to show some movement.
Values, on the other hand, remain soft with few signs of recovery.
Some of the factors that could be making an indirect impact on values relate to finance. Major lenders are adapting to the 20-year rule. That is, the age of the aircraft and term of the loan cannot exceed 20 years. Prior to the economic meltdown, it was a 30-year rule. Of course, there are exceptions to every rule, but this 20-year rule will continue to have a softening effect on value in the pre-owned market.
Another factor that might have a driving effect is the increase in cash buyers. Cash is a hard snare to turn away from if you are selling an aircraft. In return, the cash buyer will demand exceptional equipment at a discounted price.
To a lesser extent, aircraft foreclosures might have an impact on the industry. Time and condition do account for values in the marketplace. If an aircraft is sold outside the box of reason, then civil litigation will probably ensue.
You, the market itself, the live dynamics of what makes this whole process happen, may have your own opinion too. Let us know your thoughts.
Jet
Bluebook-at-a-glance
Increased — 3
Decreased — 595
Stable — 281
Late-model, large-cabin aircraft are retaining value. The medium-range business jet, such as the Lear 45 series and the Hawker 800 series, continues to show signs of normal depreciation.
Citation X and the Sovereign were off from last quarter. Bombardier Global Express and the 5000 remained steady while the Challenger 604 declined. The Falcon 7X held steady, but the Falcon 50 was down. Values for late-model Gulfstreams held steady, yet values for earlier models were off.
Turboprop
Bluebook-at-a-glance
Increased — 25
Decreased — 135
Stable — 434
The ag market still rules in this category because the very boutique and limited markets hold on to value.
One surprise this quarter is the DeHavilland Twin Otter DHC-6. Limited inventories, great demand and a new production line have brought a burst of life into the values of these aircraft. Check the values in the new fall 2010 release of Aircraft Bluebook.
Late-model King Airs were down slightly.
Multi
Bluebook-at-a-glance
Increased — 12
Decreased — 26
Stable — 618
Time and condition will play the upper hand in this market, especially when dealing with aging aircraft. Anything more than 20 years old in this market is a senior citizen. For the most part, values for this segment remained unmoved when compared to the previous quarter.
Single
Bluebook-at-a-glance
Increased — 217
Decreased — 200
Stable — 2078
As with their twin brethren, time and condition also have the upper hand in supporting value. Do not just look at the sale price. Also pay close attention to restorations, upgrades and modifications.
For the most part, the single category was stable.
Helicopter
Bluebook-at-a-glance
Increased — 57
Decreased — 221
Stable — 761
Helicopters are continuing to show some signs of stabilization with the majority of this segment remaining unchanged in reported values when compared to the previous quarter.
Visit us at the 2010 NBAA Annual Meeting & Convention
Aircraft Bluebook will be in booth No. 7626 at NBAA 2010 on Oct. 19-21.
Aircraft Bluebook – Price Digest here for you
Please contact Aircraft Bluebook if you have any specific concern in a particular aircraft market. We will be happy to share with you the most up-to-date information available for your market segment. Call us toll-free at 877-531-1450 or direct at 913-967-1913.
[Go to Charts.]
CHARTS — AUG. 18, 2010
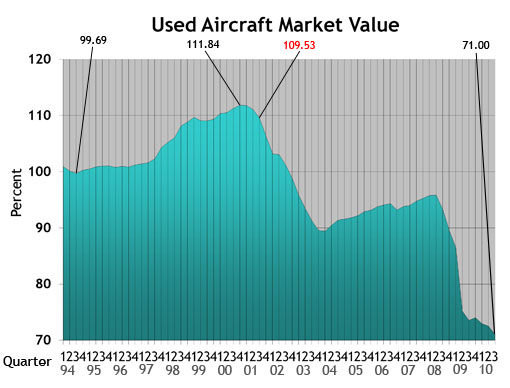 Used Aircraft Market: This chart displays each model's quarterly value in relationship to its average equipped price at the inception of the aircraft. The study begins in the spring quarter of 1994 and includes the Jet, Turboprop, Multi, Piston and Helicopter. For all charts, the red number indicates the first reporting date after 9-11.
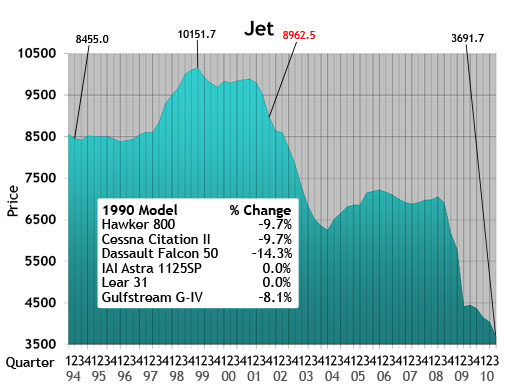 Jet: The jet chart depicts the average price (in thousands) of the six 1990s jets listed in the box.
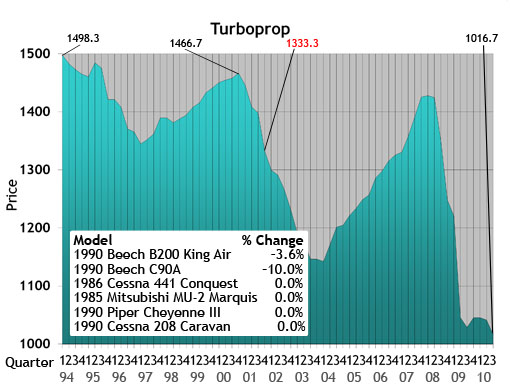 Turboprop: The turboprop chart depicts the average price (in thousands) of a 1985, 1986 and four 1990 turboprops listed in the box.
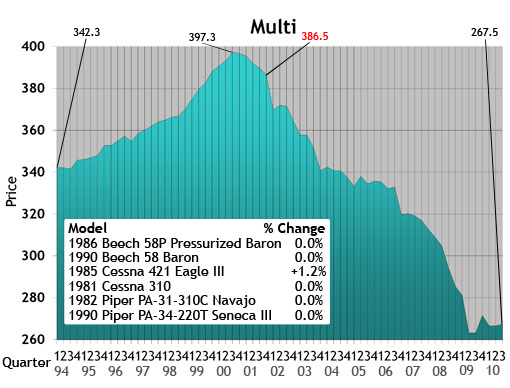 Multi: The multi chart depicts the average price (in thousands) of the six multi models listed in the box. Each model’s year will precede the name of the aircraft.
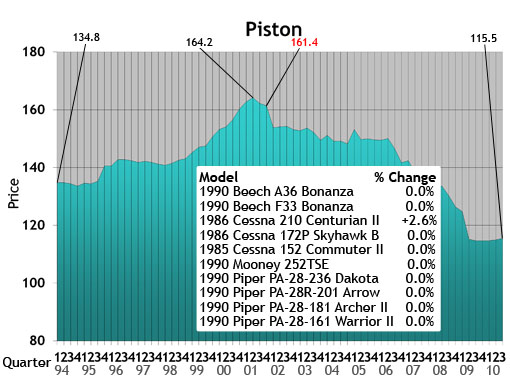 Piston: The piston chart depicts the average price (in thousands) of the 10 pistons listed in the box. Each model’s year will precede the name of the aircraft.
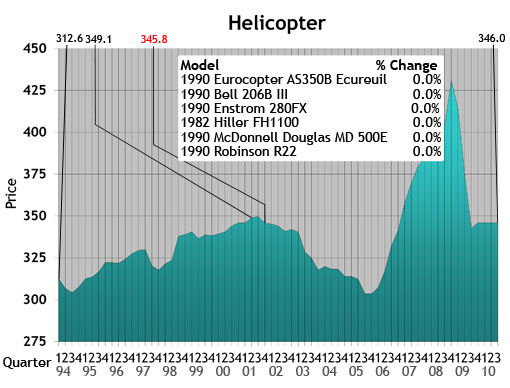 Helicopter: The helicopter chart depicts the average price (in thousands) of the six helicopters listed in the box. Each model’s year will precede the name of the aircraft.
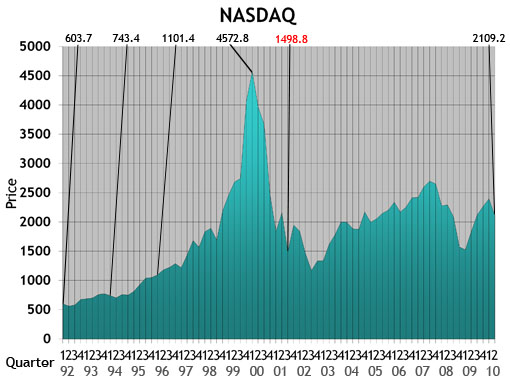 NASDAQ: This ratio scale chart depicts the change for the NASDAQ daily average from quarter to quarter beginning at the end of the first quarter of 1992. Each data point represents the closing daily average on the last trading day of each quarter. This study originates in the first quarter of 1971.
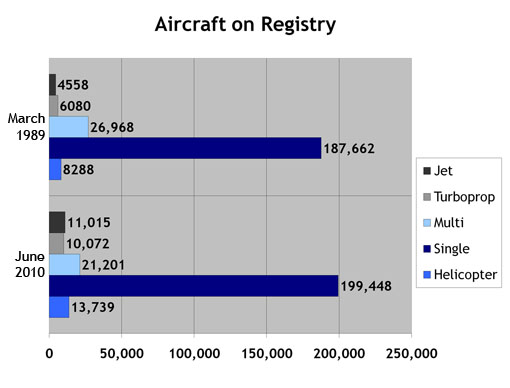 Aircraft on Registry: The Aircraft on Registry chart depicts the number of aircraft reported in Aircraft Bluebook that are listed on FAA records and considered to be in the U.S. inventory.
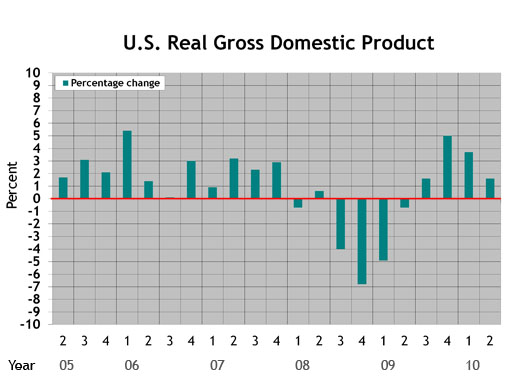 U.S. Real Gross Domestic Product (updated Aug. 27, 2010): This graph represents real gross domestic product measured by the U.S. Bureau of Economic Analysis. Each data point represents the BEA's final figure or latest estimate of the quarter-to-quarter seasonally adjusted annual rates of change in real GDP "based on chained 2005 dollars." The study begins with the second quarter in 2005.
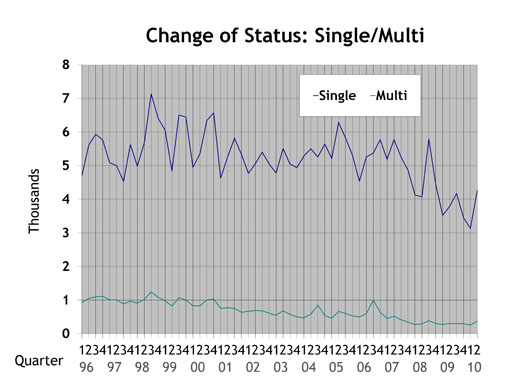 Single/Multi: The blue line in the Single/Multi chart depicts change-of-ownership data for singles. The black line represents multis.
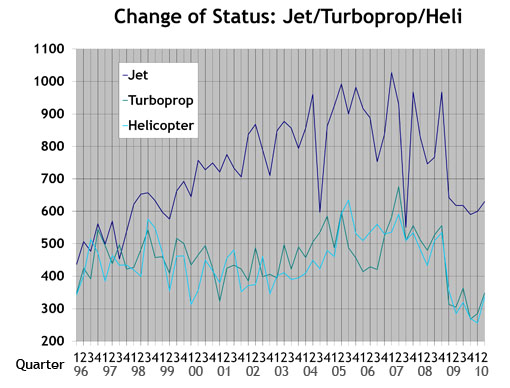 Jet/Turboprop/Heli: The black line in the Jet/Turboprop/Heli chart represents change-of-ownership information for jets. The blue line depicts turboprops, and the gray line represents helicopters.
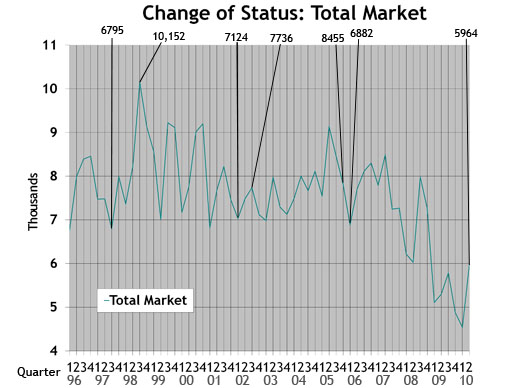 Total Market: Depicts change-of-ownership data for all aircraft included in the Aircraft Bluebook. The numbers are from the FAA Registry. Gliders, homebuilts, airliners and other aircraft not found in the Bluebook are not included in this study.
Update on Friday, August 27, 2010 at 2:02PM by
Aircraft Bluebook Marketline
Aircraft Bluebook Marketline
After the revised second quarter GDP estimate came out on Aug. 27, 2010, we updated the GDP graph to include most recent revisions.
AIRCRAFT PRICES REMAIN STABLE WHILE SIGNS OF RECOVERY GLIMMER IN DUBAI
Vol. 22, No. 4 | Nov. 30, 2009 | Go to Charts
by Carl Janssens, ASA | Aircraft Bluebook — Price Digest
Entering its home stretch, 2009 certainly has been a forgettable year for general aviation. The losses in value for most owners of corporate aircraft have been significant and, at times, have even been heartbreaking.
However, something is happening out there. While economists predict an economic recovery will be achingly slow, some aircraft values are moving up. The change is barely perceptible and does not apply to every market segment. But inventories are finally contracting instead of expanding, and dealers are again becoming cautiously optimistic.
At the Dubai Airshow, Aircraft Bluebook–Price Digest has witnessed upbeat attitudes.
Aircraft Bluebook was represented in Dubai with its sister publications AC-U-KWIK and The Air Charter Guide. These publications are intricately involved in all aspects of corporate aviation, including aircraft values, FBOs, ground transportation, lodging or a multitude of other support services. At the Dubai Airshow, business was robust. The publications experienced record advertising and book sales.
This trade show in Dubai reflects the health of the international corporate aviation segment. We can hope that the skies over North America will soon host greater numbers of corporate jets giving lift to the companies that use corporate aviation to propel themselves out of these dark times.
While the economy thumbs for a lift, corporate aviation is showing signs of lifting the economy. Remember the National Business Aviation Association and General Aviation Manufacturers Association’s campaign slogan: “No Plane, No Gain.”
Jet
Bluebook-at-a-glance
Increased — 46
Decreased — 160
Stable — 652
For large-cabin/long-range aircraft, inventories have firmed with sale prices holding at what should be considered bottom market pricing. The bottom market seekers still waiting for a better opportunity may be surprised when the uptick in values reemerges.
The Lear 31 and Cessna 525 had values in the plus column. The Gulfstream G-IV and Bombardier Challenger 601 experienced minor decreases.
Turboprop
Bluebook-at-a-glance
Increased — 126
Decreased — 11
Stable — 453
Turboprop ag planes continue to demonstrate improved values for yet another quarter. The Piaggio P180 and the family of Piper Cheyennes experienced modest gains. Also in the plus column were the 300 series Beechcraft King Air. Values for select 90 series Beechcraft King Airs were down slightly from the previous quarter. Most aircraft in this category remained stable.
Multi
Bluebook-at-a-glance
Increased — 32
Decreased — 37
Stable — 586
Aerostars experienced minor increases in value. The Cessna 421 also demonstrated modest increases when compared to the previous quarter. The Beech Duke and Cessna 414 values were down slightly. Most values reflected no change.
Single
Bluebook-at-a-glance
Increased — 132
Decreased — 108
Stable — 2209
Ag planes kept a positive note for another quarter. The Cirrus SR20 also improved modestly in select model years. For the most part, the majority of single-engine piston aircraft held steady. Decreases in value were minimal. Select Mooneys were down a few thousand dollars.
Helicopter
Bluebook-at-a-glance
Increased — 62
Decreased — 170
Stable — 770
The helicopter markets reported in Bluebook appear to be leveling off as well. Most models were stable for the reporting quarter. Eurocopter Twin Stars as well as the Bell 206 series were up slightly. Some values declining for this quarter include the Eurocopter AS350 and the Bell 430.
Contact Aircraft Bluebook
Please contact Aircraft Bluebook if you have any specific concern in a particular aircraft market. We will be happy to share with you the most up-to-date information available for your market segment. Call us at 877-531-1450 or 913-967-1913.
[Go to Charts.]
tagged Beech, Bell, Cessna, Cirrus, Eurocopter, Hhelicopter, economy, jet, multi, piston, single, turboprop in Newsletter
Newsletter