tagged  Beech, Cessna, Eurocopter AS350B Ecureuil, Piper, aircraft on registry, helicopter, jet, multi, piston, pre-owned aircraft, turboprop, used aircraft in Charts
Charts 


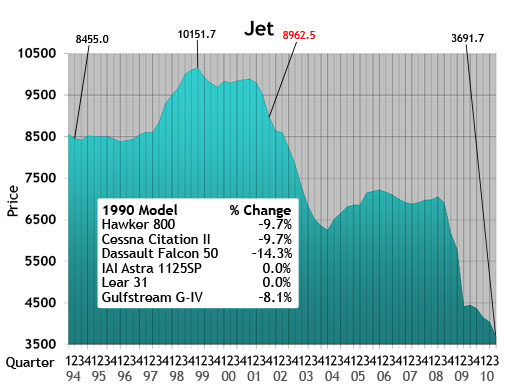
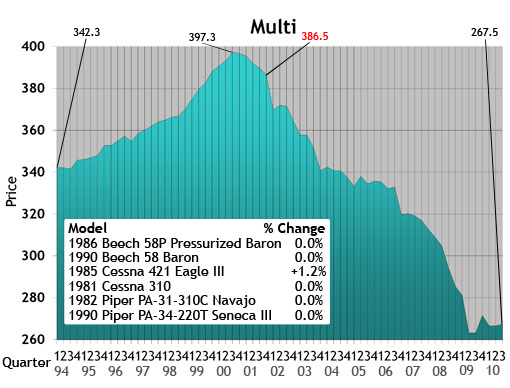
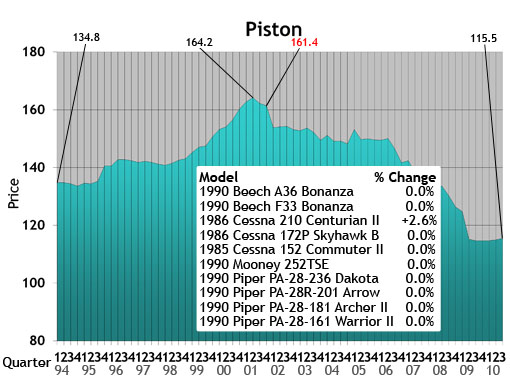
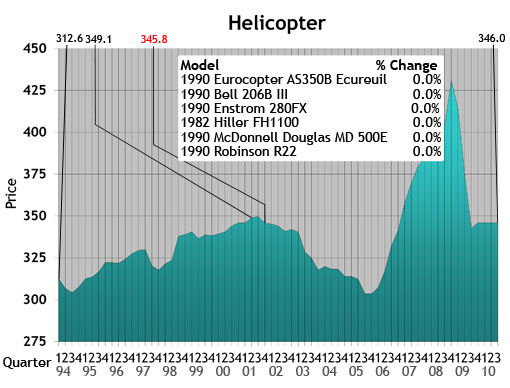
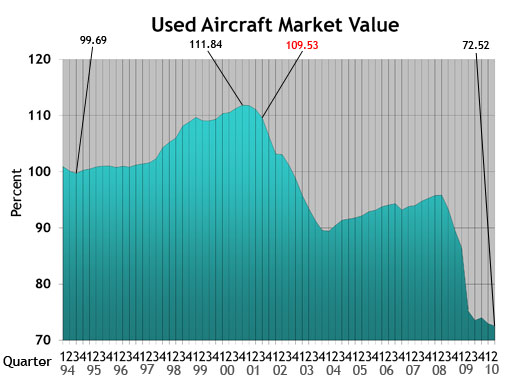
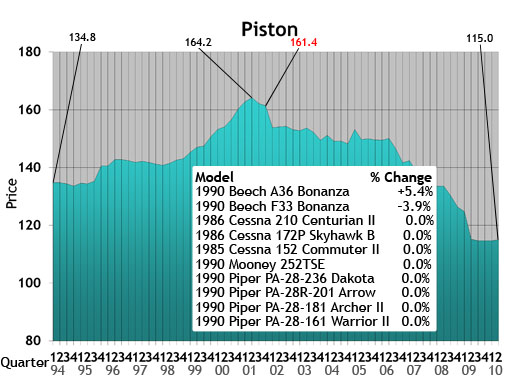
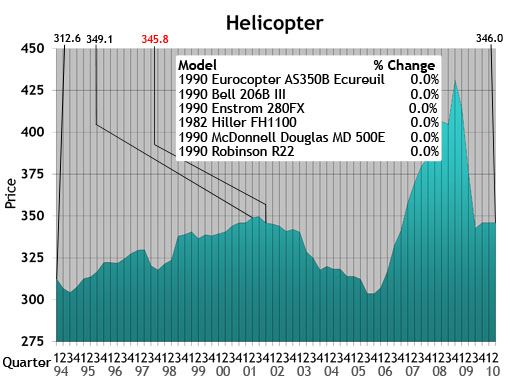
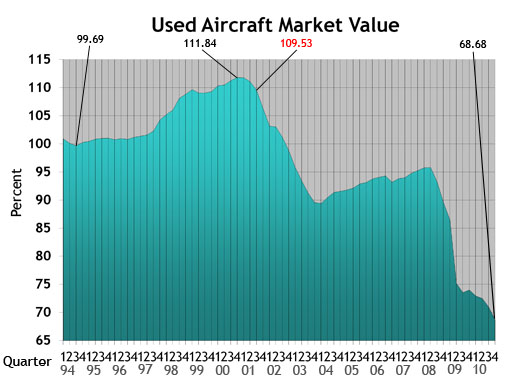 Used Aircraft Market: This chart displays each model's quarterly value in relationship to its average equipped price at the inception of the aircraft. The study begins in the spring quarter of 1994 and includes the Jet, Turboprop, Multi, Piston and Helicopter. For all charts, the red number indicates the first reporting date after 9-11.
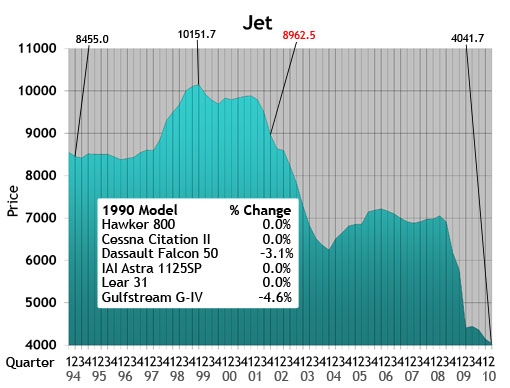
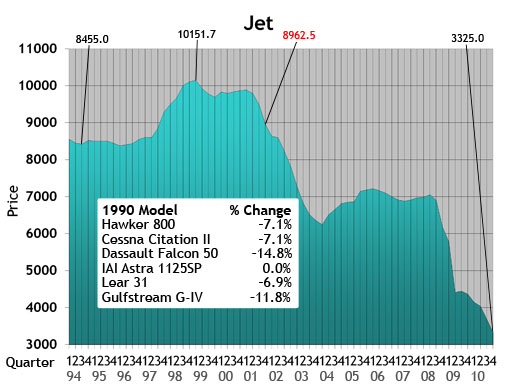 Jet: The jet chart depicts the average price (in thousands) of the six 1990s jets listed in the box.
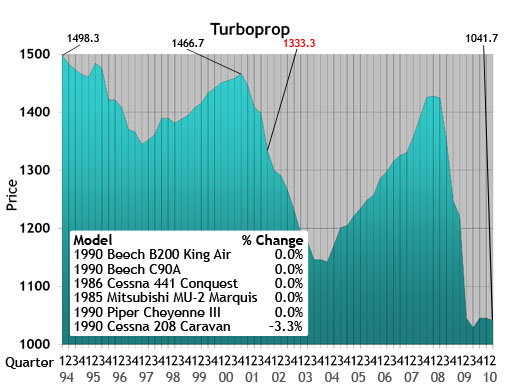
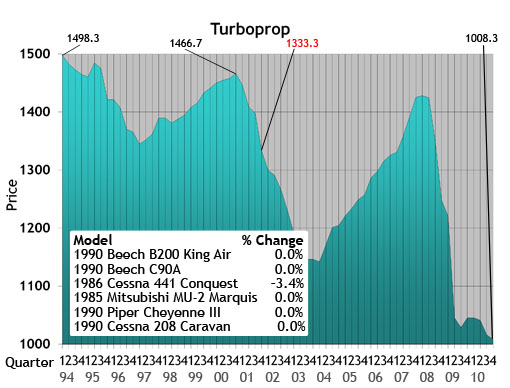 Turboprop: The turboprop chart depicts the average price (in thousands) of a 1985, 1986 and four 1990 turboprops listed in the box.
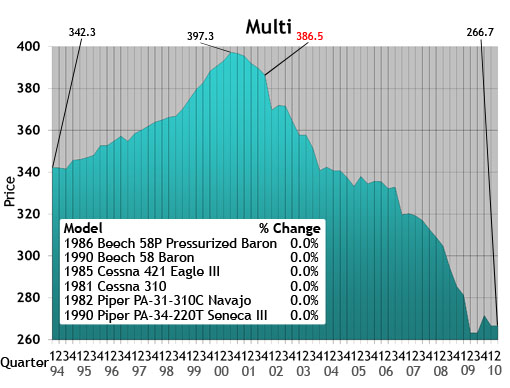
 Multi: The multi chart depicts the average price (in thousands) of the six multi models listed in the box. Each model’s year will precede the name of the aircraft.
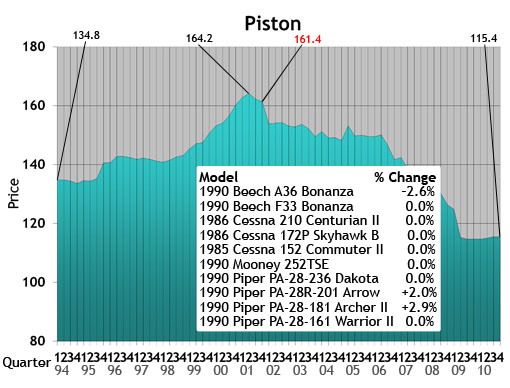 Piston: The piston chart depicts the average price (in thousands) of the 10 pistons listed in the box. Each model’s year will precede the name of the aircraft.
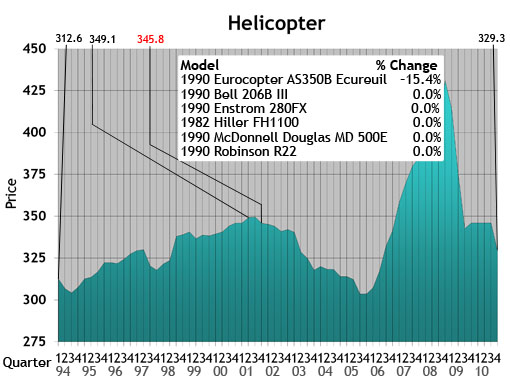 Helicopter: The helicopter chart depicts the average price (in thousands) of the six helicopters listed in the box. Each model’s year will precede the name of the aircraft.
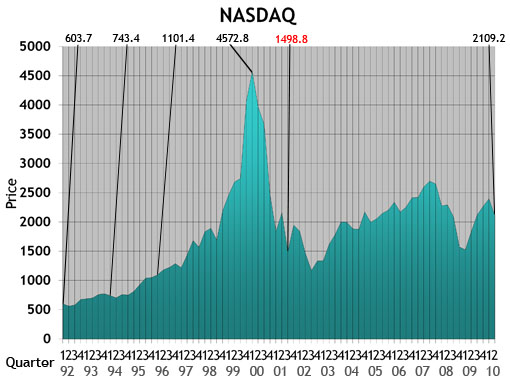
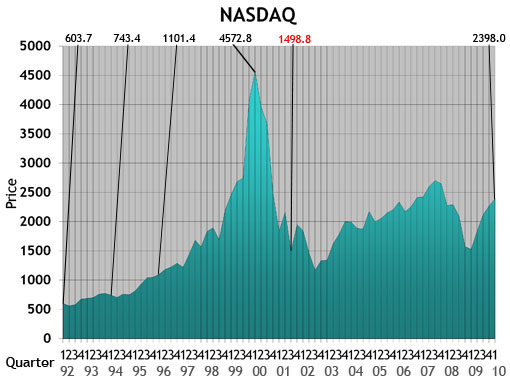
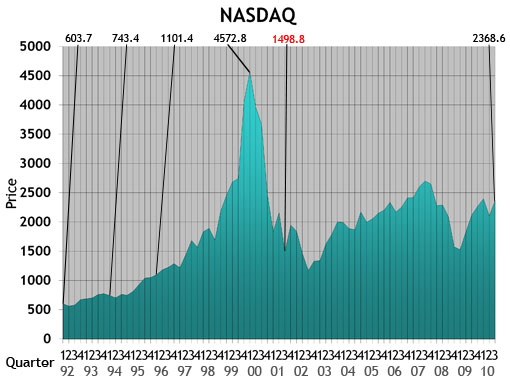 NASDAQ: This ratio scale chart depicts the change for the NASDAQ daily average from quarter to quarter beginning at the end of the first quarter of 1992. Each data point represents the closing daily average on the last trading day of each quarter. This study originates in the first quarter of 1971.
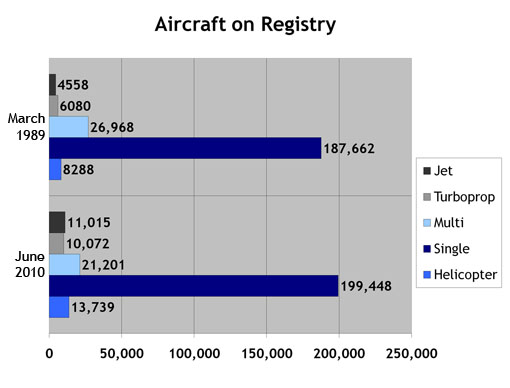
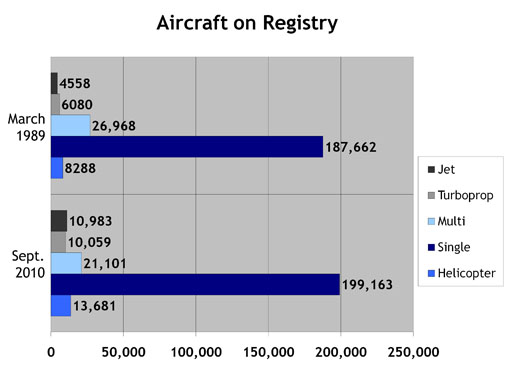 Aircraft on Registry: The Aircraft on Registry chart depicts the number of aircraft reported in Aircraft Bluebook that are listed on FAA records and considered to be in the U.S. inventory.
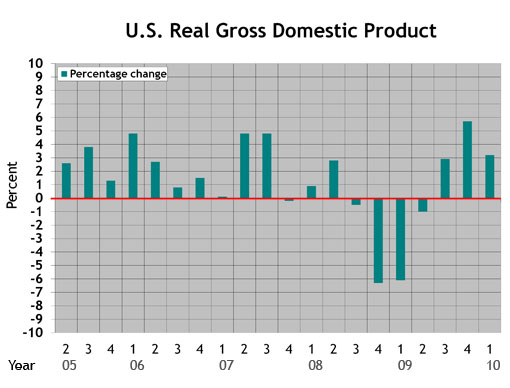
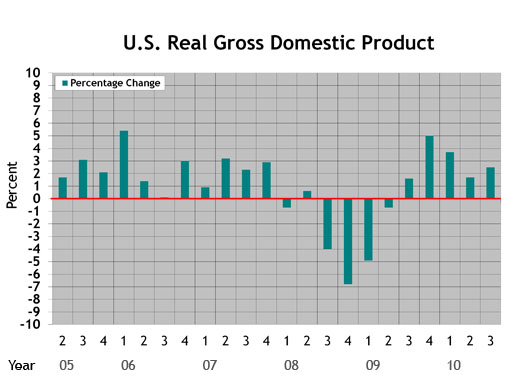 U.S. Real Gross Domestic Product (updated Aug. 27, 2010): This graph represents real gross domestic product measured by the U.S. Bureau of Economic Analysis. Each data point represents the BEA's final figure or latest estimate of the quarter-to-quarter seasonally adjusted annual rates of change in real GDP "based on chained 2005 dollars." The study begins with the second quarter in 2005.
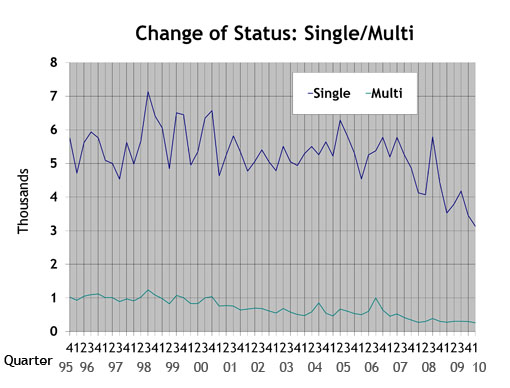
 Single/Multi: The blue line in the Single/Multi chart depicts change-of-ownership data for singles. The black line represents multis.
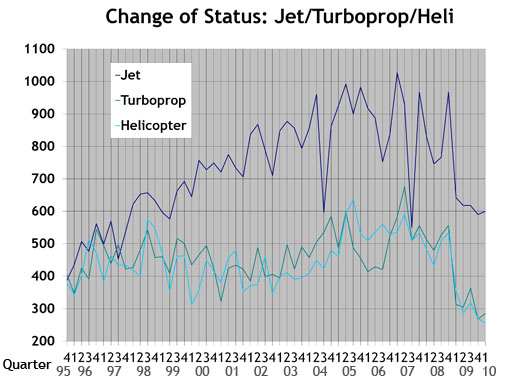
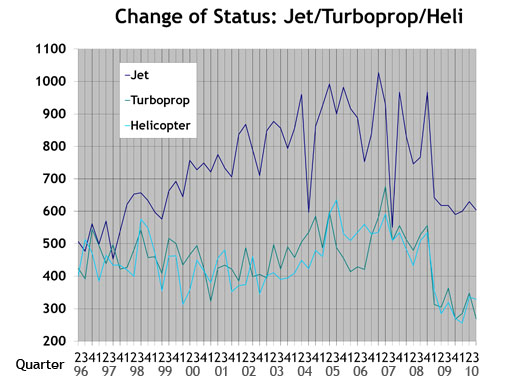 Jet/Turboprop/Heli: The black line in the Jet/Turboprop/Heli chart represents change-of-ownership information for jets. The blue line depicts turboprops, and the gray line represents helicopters.
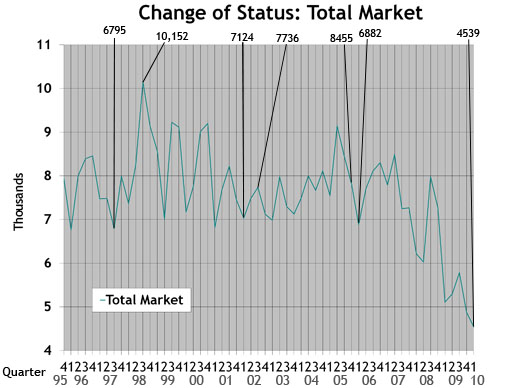
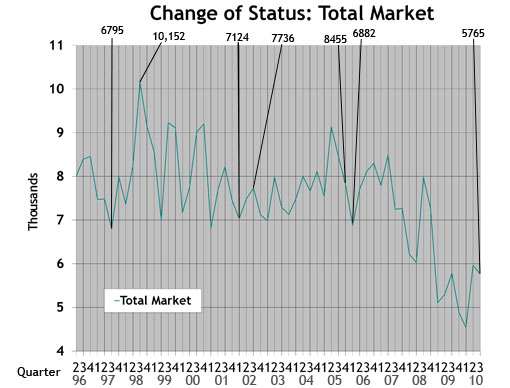 Total Market: Depicts change-of-ownership data for all aircraft included in the Aircraft Bluebook. The numbers are from the FAA Registry. Gliders, homebuilts, airliners and other aircraft not found in the Bluebook are not included in this study.
by Carl Janssens, ASA | Aircraft Bluebook — Price Digest
There should be some optimism in our industry.
Buyers and sellers are finally coming to terms with what the market will bear for a given aircraft. And with that, the pre-owned aircraft market is seeing more completed deals. The gridlock of available inventory is starting to show some movement.
Values, on the other hand, remain soft with few signs of recovery.
Some of the factors that could be making an indirect impact on values relate to finance. Major lenders are adapting to the 20-year rule. That is, the age of the aircraft and term of the loan cannot exceed 20 years. Prior to the economic meltdown, it was a 30-year rule. Of course, there are exceptions to every rule, but this 20-year rule will continue to have a softening effect on value in the pre-owned market.
Another factor that might have a driving effect is the increase in cash buyers. Cash is a hard snare to turn away from if you are selling an aircraft. In return, the cash buyer will demand exceptional equipment at a discounted price.
To a lesser extent, aircraft foreclosures might have an impact on the industry. Time and condition do account for values in the marketplace. If an aircraft is sold outside the box of reason, then civil litigation will probably ensue.
You, the market itself, the live dynamics of what makes this whole process happen, may have your own opinion too. Let us know your thoughts.
Bluebook-at-a-glance
Increased — 3
Decreased — 595
Stable — 281
Late-model, large-cabin aircraft are retaining value. The medium-range business jet, such as the Lear 45 series and the Hawker 800 series, continues to show signs of normal depreciation.
Citation X and the Sovereign were off from last quarter. Bombardier Global Express and the 5000 remained steady while the Challenger 604 declined. The Falcon 7X held steady, but the Falcon 50 was down. Values for late-model Gulfstreams held steady, yet values for earlier models were off.
Bluebook-at-a-glance
Increased — 25
Decreased — 135
Stable — 434
The ag market still rules in this category because the very boutique and limited markets hold on to value.
One surprise this quarter is the DeHavilland Twin Otter DHC-6. Limited inventories, great demand and a new production line have brought a burst of life into the values of these aircraft. Check the values in the new fall 2010 release of Aircraft Bluebook.
Late-model King Airs were down slightly.
Bluebook-at-a-glance
Increased — 12
Decreased — 26
Stable — 618
Time and condition will play the upper hand in this market, especially when dealing with aging aircraft. Anything more than 20 years old in this market is a senior citizen. For the most part, values for this segment remained unmoved when compared to the previous quarter.
Bluebook-at-a-glance
Increased — 217
Decreased — 200
Stable — 2078
As with their twin brethren, time and condition also have the upper hand in supporting value. Do not just look at the sale price. Also pay close attention to restorations, upgrades and modifications.
For the most part, the single category was stable.
Bluebook-at-a-glance
Increased — 57
Decreased — 221
Stable — 761
Helicopters are continuing to show some signs of stabilization with the majority of this segment remaining unchanged in reported values when compared to the previous quarter.
Aircraft Bluebook will be in booth No. 7626 at NBAA 2010 on Oct. 19-21.
Please contact Aircraft Bluebook if you have any specific concern in a particular aircraft market. We will be happy to share with you the most up-to-date information available for your market segment. Call us toll-free at 877-531-1450 or direct at 913-967-1913.
 Used Aircraft Market: This chart displays each model's quarterly value in relationship to its average equipped price at the inception of the aircraft. The study begins in the spring quarter of 1994 and includes the Jet, Turboprop, Multi, Piston and Helicopter. For all charts, the red number indicates the first reporting date after 9-11.
 Jet: The jet chart depicts the average price (in thousands) of the six 1990s jets listed in the box.
 Turboprop: The turboprop chart depicts the average price (in thousands) of a 1985, 1986 and four 1990 turboprops listed in the box.
 Multi: The multi chart depicts the average price (in thousands) of the six multi models listed in the box. Each model’s year will precede the name of the aircraft.
 Piston: The piston chart depicts the average price (in thousands) of the 10 pistons listed in the box. Each model’s year will precede the name of the aircraft.
 Helicopter: The helicopter chart depicts the average price (in thousands) of the six helicopters listed in the box. Each model’s year will precede the name of the aircraft.
 NASDAQ: This ratio scale chart depicts the change for the NASDAQ daily average from quarter to quarter beginning at the end of the first quarter of 1992. Each data point represents the closing daily average on the last trading day of each quarter. This study originates in the first quarter of 1971.
 Aircraft on Registry: The Aircraft on Registry chart depicts the number of aircraft reported in Aircraft Bluebook that are listed on FAA records and considered to be in the U.S. inventory.
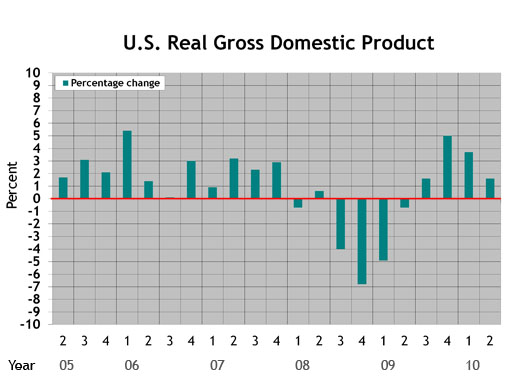 U.S. Real Gross Domestic Product (updated Aug. 27, 2010): This graph represents real gross domestic product measured by the U.S. Bureau of Economic Analysis. Each data point represents the BEA's final figure or latest estimate of the quarter-to-quarter seasonally adjusted annual rates of change in real GDP "based on chained 2005 dollars." The study begins with the second quarter in 2005.
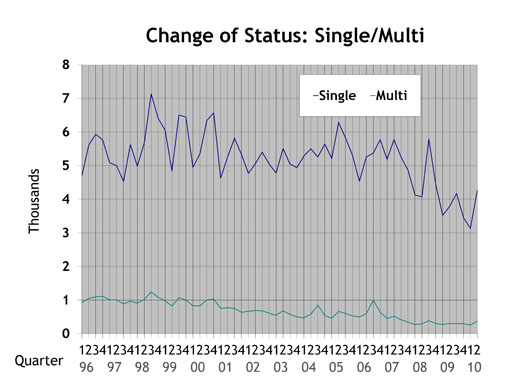 Single/Multi: The blue line in the Single/Multi chart depicts change-of-ownership data for singles. The black line represents multis.
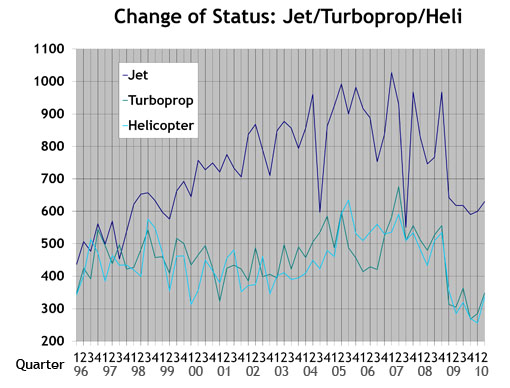 Jet/Turboprop/Heli: The black line in the Jet/Turboprop/Heli chart represents change-of-ownership information for jets. The blue line depicts turboprops, and the gray line represents helicopters.
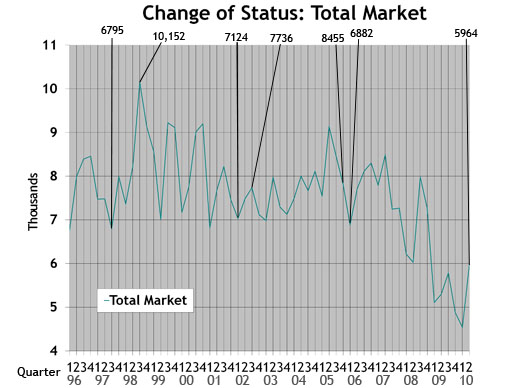 Total Market: Depicts change-of-ownership data for all aircraft included in the Aircraft Bluebook. The numbers are from the FAA Registry. Gliders, homebuilts, airliners and other aircraft not found in the Bluebook are not included in this study.
Aircraft Bluebook Marketline
After the revised second quarter GDP estimate came out on Aug. 27, 2010, we updated the GDP graph to include most recent revisions.
by Carl Janssens, ASA | Aircraft Bluebook — Price Digest
Finally, the pre-owned aircraft market moved in a positive direction in the first quarter of 2010. Late-model, large-cabin, long-range aircraft were selling at or better than values published in the Aircraft Bluebook.
External factors such as increased sales, a slight decline of available inventory and world market competition could all be considered causes for the improvement. Although this early indication of a slow recovery is in progress, it is too early to celebrate. Any positive sign going forward is far better than where the used aircraft market has been.
With the exception of the late-model, large-cabin class, most of the other business aircraft are not yet recovering in value. The good news is that values are showing more stability. Market activity is on the rise leaving a more optimistic perception that values are not exposed to the risks experienced in the last twenty months.
A couple considerations might be affecting values in the pre-owned aircraft market. The first is available credit for qualified buyers, and the second is the price of fuel. Part of the dilemma that played a major role in an injured economy was the lack of finance. Now, aircraft lenders are able to enable more transactions. This new reality will move the aircraft market into better days. At the same time, credit could indicate how aircraft values will rebound as elements of risks financial institutions are willing to take will have an indirect impact on value. Energy and the price of crude oil is the other factor that will impact further recovery. As long as there are no surprising jumps in the price of crude oil in a limited time frame, the aircraft market will be able to absorb the daily fluctuations in oil prices and prevent the cost of fuel from becoming a deterrent in this industry’s recovery.
Bluebook-at-a-glance
Increased — 5
Decreased — 410
Stable — 462
As reported above, late-model, large-cabin aircraft are retaining value. Select Gulfstream G550s were up $1 million with the remainder of these aircraft holding steady in value. The Gulfstream G-V market remained unchanged. The G-IV values were off an average of $500,000. Bombardier Global Express and the Global 5000 also held steady while inventories for sale decreased. The Bombardier Lear 45 series was off $200,000 on average. The Cessna Citation Excel series was down an average of $200,000 as well. Light jets such as the Beech Premier were off an average of $200,000. The Hawker 400 was down $100,000. The Citation 525 was off slightly as well.
Bluebook-at-a-glance
Increased — 55
Decreased — 86
Stable — 452
The ag market values improved slightly when compared to the previous quarter. Late-model Beechcraft King Airs remained stable. Earlier models generally also held on, though some models trended downward. Reduction in production for the King Air series might have some positive benefits. In time, limited production could cause limited inventories for sale in the pre-owned market, which would then cause values to strengthen. The Cessna Conquest was stable for yet another quarter. The Piper Meriden was down $50,000.
Bluebook-at-a-glance
Increased — 29
Decreased — 103
Stable — 523
The Beech Baron family of piston twins achieved some slight gains in value. Early-model 58s were up slightly. Select Baron 55 models also experienced narrow gains. For the most part, however, decreases in value were slight but across the board. Cessna 310 values were down, and the Diamond Twin Star was off $10,000.
Bluebook-at-a-glance
Increased — 311
Decreased — 267
Stable — 1909
Select ag planes generally made slight gains. Values of early-model Beech Bonanza A36s were up from the previous quarter. Late-model Cessna 172 Skyhawks and Cessna 206s reported slightly higher values for the summer release of Aircraft Bluebook. Commanders and Mooneys were generally off $5,000 to $10,000 when compared to the previous quarter. The majority of aircraft in this reporting segment remained stable.
Bluebook-at-a-glance
Increased — 52
Decreased — 170
Stable — 809
The Enstrom F28/280 series improved slightly from the previous quarter. Compared to the previous quarter, select models of the Eurocopter Twin Star were off $100,000. The Bell 430 also declined an average of $300,000 from previous reported values. The Enstrom 480 was down $50,000. The helicopter segment remained stable for the most part.
Please contact Aircraft Bluebook if you have any specific concern in a particular aircraft market. We will be happy to share with you the most up-to-date information available for your market segment. Call us toll-free at 877-531-1450 or direct at 913-967-1913.
 Used Aircraft Market: This chart displays each model's quarterly value in relationship to its average equipped price at the inception of the aircraft. The study begins in the spring quarter of 1994 and includes the Jet, Turboprop, Multi, Piston and Helicopter. For all charts, the red number indicates the first reporting date after 9-11.
 Jet: The jet chart depicts the average price (in thousands) of the six 1990s jets listed in the box.
 Turboprop: The turboprop chart depicts the average price (in thousands) of a 1985, 1986 and four 1990 turboprops listed in the box.
 Multi: The multi chart depicts the average price (in thousands) of the six multi models listed in the box. Each model’s year will precede the name of the aircraft.
 Piston: The piston chart depicts the average price (in thousands) of the 10 pistons listed in the box. Each model’s year will precede the name of the aircraft.
 Helicopter: The helicopter chart depicts the average price (in thousands) of the six helicopters listed in the box. Each model’s year will precede the name of the aircraft.
 NASDAQ: This ratio scale chart depicts the change for the NASDAQ daily average from quarter to quarter beginning at the end of the first quarter of 1992. Each data point represents the closing daily average on the last trading day of each quarter. This study originates in the first quarter of 1971.
 Aircraft on Registry: The Aircraft on Registry chart depicts the number of aircraft reported in Aircraft Bluebook that are listed on FAA records and considered to be in the U.S. inventory.
 U.S. Real Gross Domestic Product: This graph represents real gross domestic product measured by the U.S. Department of Commerce. Each data point represents the percentage change from the 2005 baseline GDP. The study begins with the second quarter in 2005.
 Single/Multi: The blue line in the Single/Multi chart depicts change-of-ownership data for singles. The black line represents multis.
 Jet/Turboprop/Heli: The black line in the Jet/Turboprop/Heli chart represents change-of-ownership information for jets. The blue line depicts turboprops, and the gray line represents helicopters.
 Total Market: Depicts change-of-ownership data for all aircraft included in the Aircraft Bluebook. The numbers are from the FAA Registry. Gliders, homebuilts, airliners and other aircraft not found in the Bluebook are not included in this study.