


Entries in turboprop (44)
PRE-OWNED AIRCRAFT TRADING CONTINUES AT MODEST PACE
Vol. 23, No. 4 | Dec. 10, 2010 | Go to Charts
by Carl Janssens, ASA | Aircraft Bluebook — Price Digest
Trading in the pre-owned aircraft market continued at a modest pace as the third quarter came to a close and aligned itself on fourth-quarter activity for 2010.
Inventories available for sale grew slightly. Also noteworthy was the decrease of aircraft being sold with minimal time-in-market exposure. Days on market were significantly higher, which allowed a better opportunity to fetch maximum value in current market conditions. Time and condition also contributed to being a variable in the equation. Well-equipped, ready-to-fly aircraft had the largest audience of interest. Price competition remained limited. Sale prices continued in a downward trend or remained stagnant according the particular model group.
Several noted outside indicators have a relationship to the health of the pre-owned aircraft market. The General Aviation Manufacturers Association (GAMA) reported that shipments of turboprops and business jets manufactured worldwide were down when compared to the same time frame in 2009. Large fleet sales, such as those announced by Embraer recently, will have a future impact on pre-owned inventories when new deliveries replace current aircraft.
On other economic fronts, the $600 billion Federal Reserve QE2 (second round of quantitative easing) has yet to be observed as an action that will create growth in the business aviation sector.
On related business fronts, brokers dealing with the sale of corporations and businesses are reporting more activity with transactions closing after a long drought. Opportunities to do business are again starting to flourish.
Jet
Bluebook-at-a-glance
Increased — 14
Decreased — 502
Stable — 370
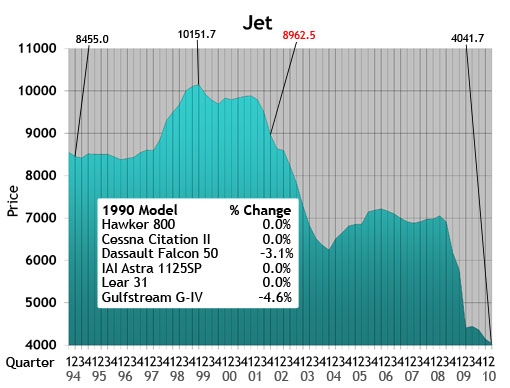
Bombardier Global Express experienced a $1 million upward trend for select model years. Bombardier Challengers were trending downward for the most part. Late-model Gulfstream G-550s were reported with a $1 million positive trend when compared to the fall Aircraft Bluebook. The Citation X was off a half million while the Sovereign was also down about $400,000. Depending on the model, most Dassault Falcons were also off when compared to the last quarter. The Hawker 800 was down $300,000. Light jets, such as the Cessna 525 were generally trending downward. Legacy Citation aircraft, such as the Citation II, were also off by about $100,000.
Turboprop
Bluebook-at-a-glance
Increased — 40
Decreased — 111
Stable — 444
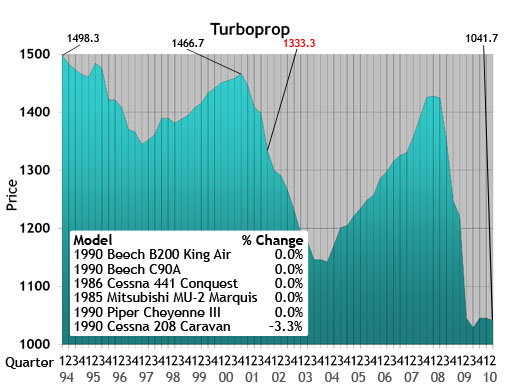
The DeHavilland Twin Otter DHC-6 again trended upward when compared to the previous quarter. The Piper Meridian PA 46TP was raised $100,000 for the winter Bluebook. Select model years of the Piaggio P180 were also up in value. Legacy aircraft, such as the Cessna Conquest and Fairchild Metro, were down for this reporting period. Select late-model Beechcraft King Airs were also down. The majority of turboprop aircraft reported in Bluebook remained stable.
Multi
Bluebook-at-a-glance
Increased — 14
Decreased — 106
Stable — 534
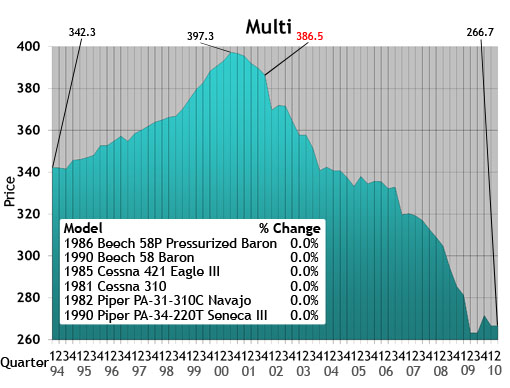
Positive gains were limited for the multi engine category. Select 340s and 414s were up about $5000. The Twin Commander Fuji 700 increased by $10,000. Most Beech Barons were off about $5000. Select Piper Twins were also down an average of $5000. Values for the majority of the multi engine category remained unchanged.
Single
Bluebook-at-a-glance
Increased — 323
Decreased — 261
Stable — 1913
Bellanca experienced some positive gains. Average retail prices for select models were up slightly from the previous quarter. See the Bluebook for details.
Select legacy Cessna and Piper singles also had minor increases when compared to the previous quarter. The majority of the single engine market segment remained unchanged.
Helicopter
Bluebook-at-a-glance
Increased — 20
Decreased — 197
Stable — 831
The Bell 205 trended upward for the winter edition of Aircraft Bluebook. The Enstrom 480 also improved in retail value when compared to the previous quarter. The majority of the helicopter segment remained unchanged.
Aircraft Bluebook–Price Digest here for you
Please contact Aircraft Bluebook if you have any specific concern in a particular aircraft market. We will be happy to share with you the most up-to-date information available for your market segment. Call us toll-free at 877-531-1450 or direct at 913-967-1913.
[Go to Charts.]
CHARTS — DEC. 10, 2010
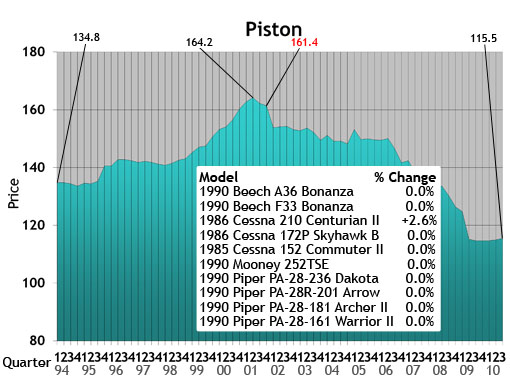
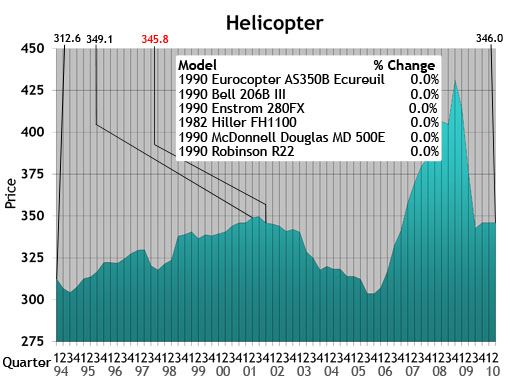
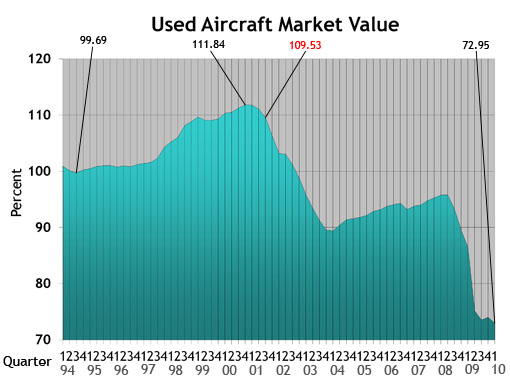
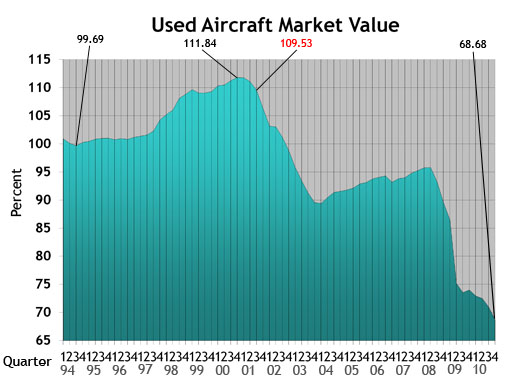 Used Aircraft Market: This chart displays each model's quarterly value in relationship to its average equipped price at the inception of the aircraft. The study begins in the spring quarter of 1994 and includes the Jet, Turboprop, Multi, Piston and Helicopter. For all charts, the red number indicates the first reporting date after 9-11.
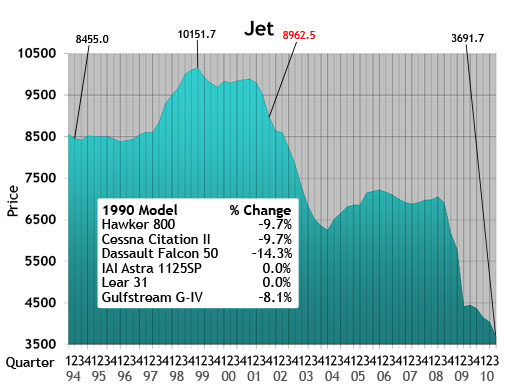
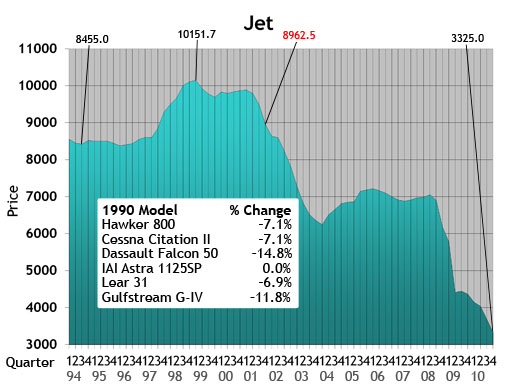 Jet: The jet chart depicts the average price (in thousands) of the six 1990s jets listed in the box.
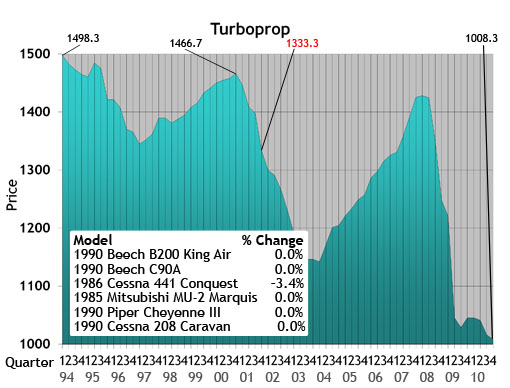 Turboprop: The turboprop chart depicts the average price (in thousands) of a 1985, 1986 and four 1990 turboprops listed in the box.
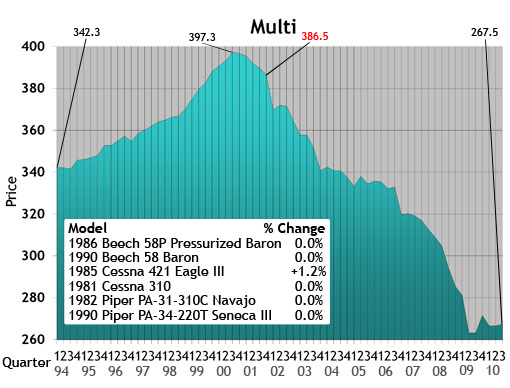
 Multi: The multi chart depicts the average price (in thousands) of the six multi models listed in the box. Each model’s year will precede the name of the aircraft.
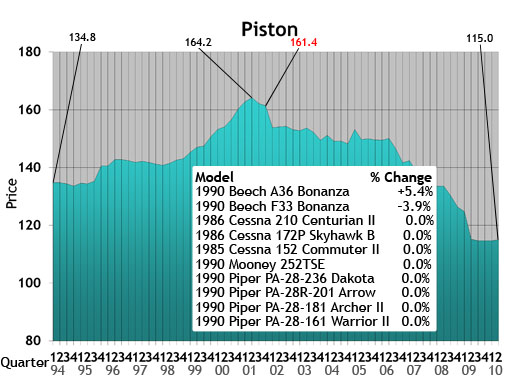
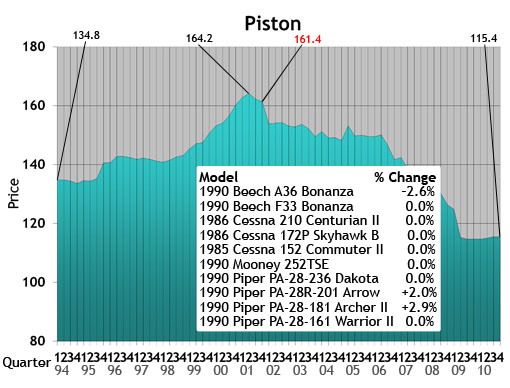 Piston: The piston chart depicts the average price (in thousands) of the 10 pistons listed in the box. Each model’s year will precede the name of the aircraft.
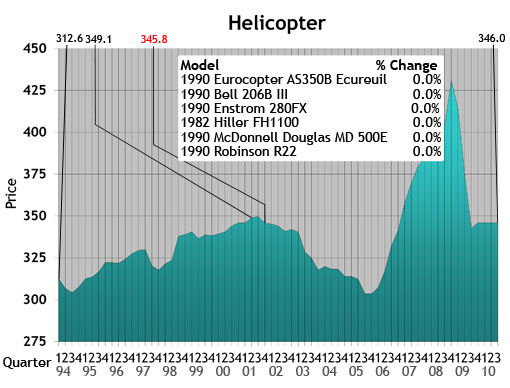
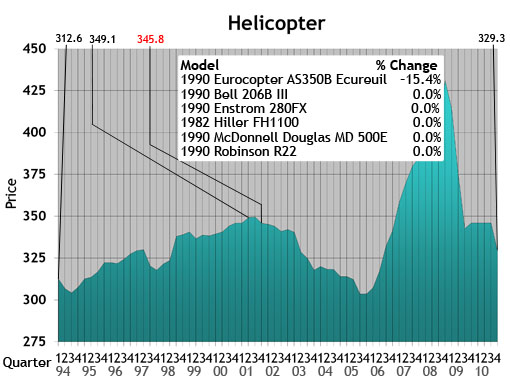 Helicopter: The helicopter chart depicts the average price (in thousands) of the six helicopters listed in the box. Each model’s year will precede the name of the aircraft.
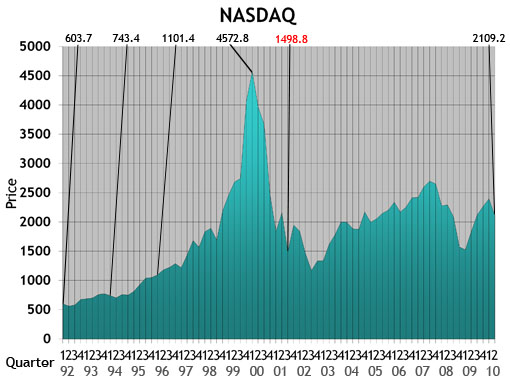
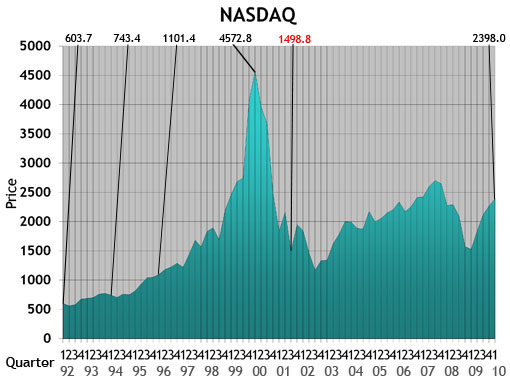
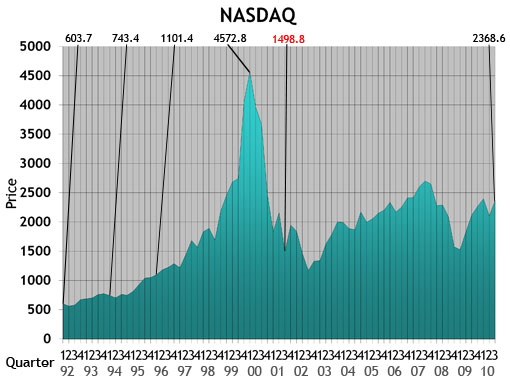 NASDAQ: This ratio scale chart depicts the change for the NASDAQ daily average from quarter to quarter beginning at the end of the first quarter of 1992. Each data point represents the closing daily average on the last trading day of each quarter. This study originates in the first quarter of 1971.
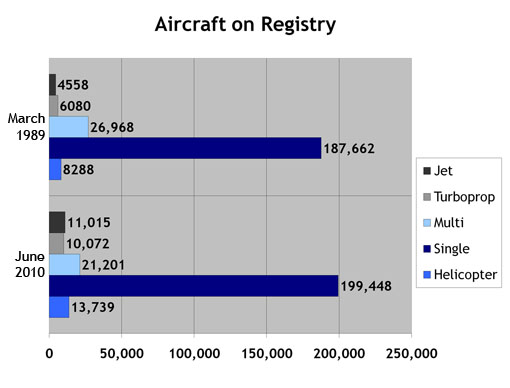
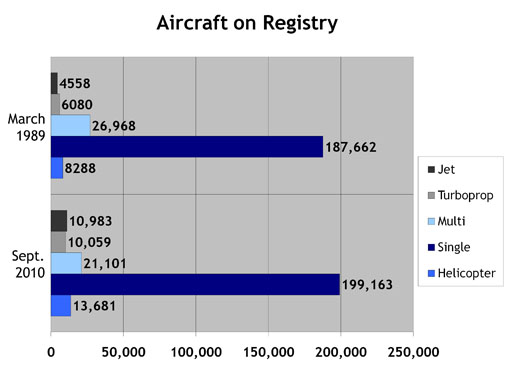 Aircraft on Registry: The Aircraft on Registry chart depicts the number of aircraft reported in Aircraft Bluebook that are listed on FAA records and considered to be in the U.S. inventory.
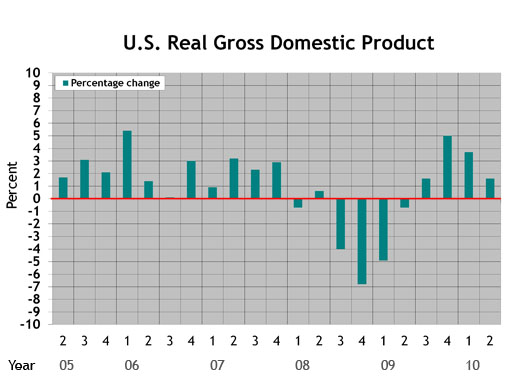
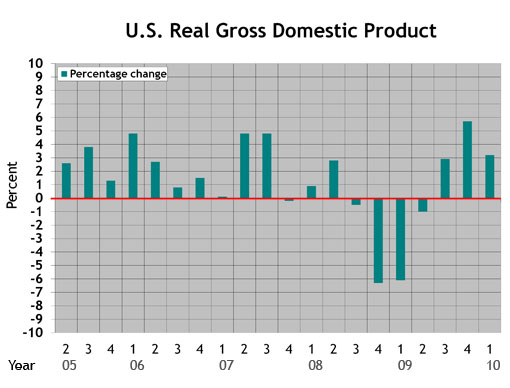
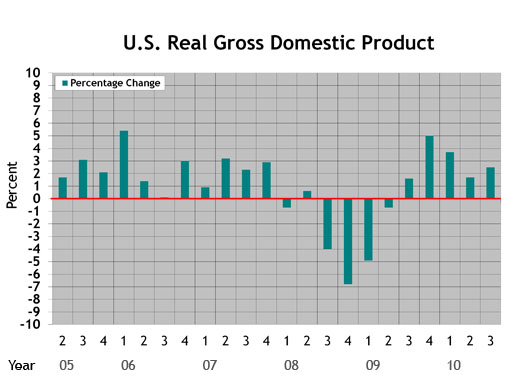 U.S. Real Gross Domestic Product (updated Aug. 27, 2010): This graph represents real gross domestic product measured by the U.S. Bureau of Economic Analysis. Each data point represents the BEA's final figure or latest estimate of the quarter-to-quarter seasonally adjusted annual rates of change in real GDP "based on chained 2005 dollars." The study begins with the second quarter in 2005.
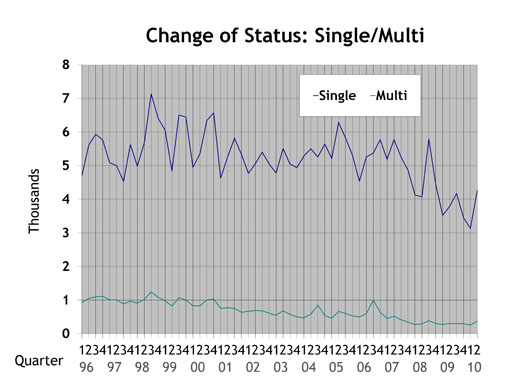
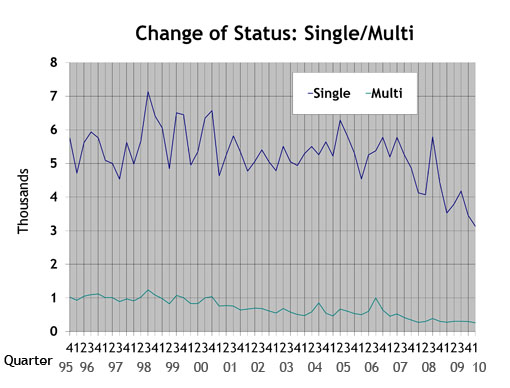
 Single/Multi: The blue line in the Single/Multi chart depicts change-of-ownership data for singles. The black line represents multis.
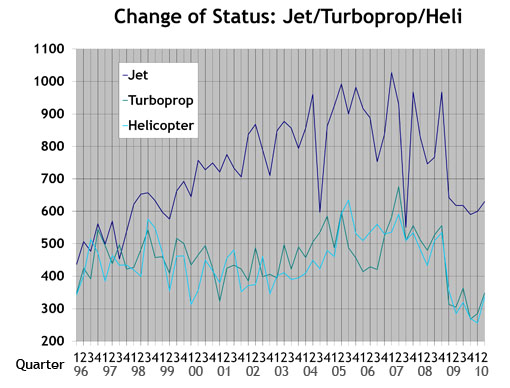
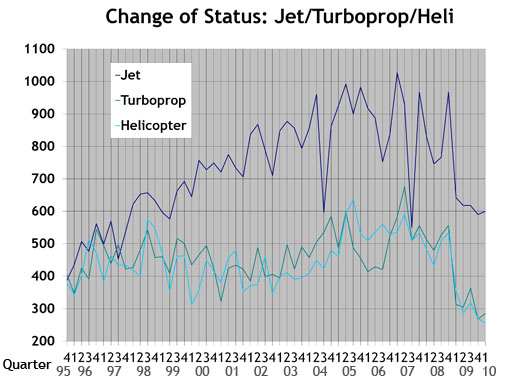
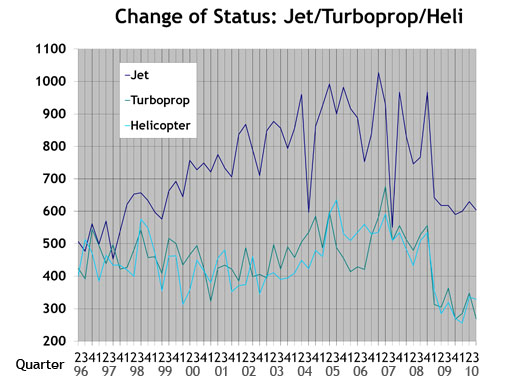 Jet/Turboprop/Heli: The black line in the Jet/Turboprop/Heli chart represents change-of-ownership information for jets. The blue line depicts turboprops, and the gray line represents helicopters.
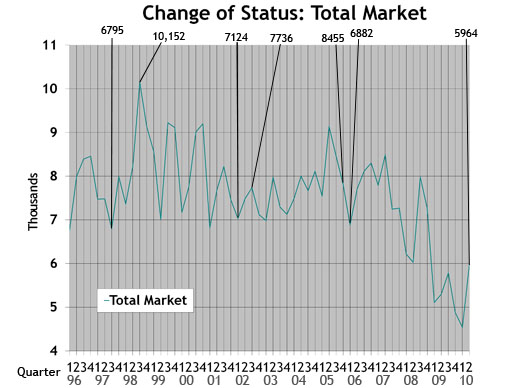
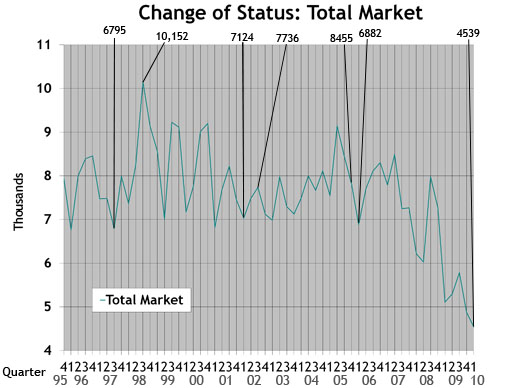
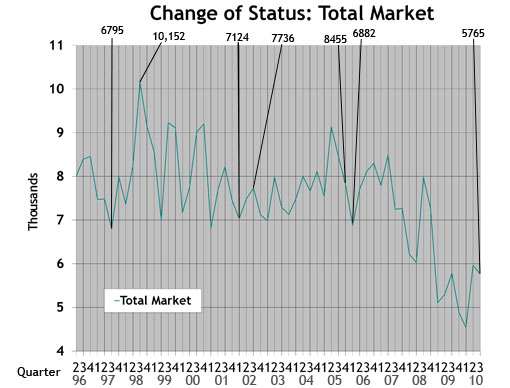 Total Market: Depicts change-of-ownership data for all aircraft included in the Aircraft Bluebook. The numbers are from the FAA Registry. Gliders, homebuilts, airliners and other aircraft not found in the Bluebook are not included in this study.
CHARTS — AUG. 18, 2010
 Used Aircraft Market: This chart displays each model's quarterly value in relationship to its average equipped price at the inception of the aircraft. The study begins in the spring quarter of 1994 and includes the Jet, Turboprop, Multi, Piston and Helicopter. For all charts, the red number indicates the first reporting date after 9-11.
 Jet: The jet chart depicts the average price (in thousands) of the six 1990s jets listed in the box.
 Turboprop: The turboprop chart depicts the average price (in thousands) of a 1985, 1986 and four 1990 turboprops listed in the box.
 Multi: The multi chart depicts the average price (in thousands) of the six multi models listed in the box. Each model’s year will precede the name of the aircraft.
 Piston: The piston chart depicts the average price (in thousands) of the 10 pistons listed in the box. Each model’s year will precede the name of the aircraft.
 Helicopter: The helicopter chart depicts the average price (in thousands) of the six helicopters listed in the box. Each model’s year will precede the name of the aircraft.
 NASDAQ: This ratio scale chart depicts the change for the NASDAQ daily average from quarter to quarter beginning at the end of the first quarter of 1992. Each data point represents the closing daily average on the last trading day of each quarter. This study originates in the first quarter of 1971.
 Aircraft on Registry: The Aircraft on Registry chart depicts the number of aircraft reported in Aircraft Bluebook that are listed on FAA records and considered to be in the U.S. inventory.
 U.S. Real Gross Domestic Product (updated Aug. 27, 2010): This graph represents real gross domestic product measured by the U.S. Bureau of Economic Analysis. Each data point represents the BEA's final figure or latest estimate of the quarter-to-quarter seasonally adjusted annual rates of change in real GDP "based on chained 2005 dollars." The study begins with the second quarter in 2005.
 Single/Multi: The blue line in the Single/Multi chart depicts change-of-ownership data for singles. The black line represents multis.
 Jet/Turboprop/Heli: The black line in the Jet/Turboprop/Heli chart represents change-of-ownership information for jets. The blue line depicts turboprops, and the gray line represents helicopters.
 Total Market: Depicts change-of-ownership data for all aircraft included in the Aircraft Bluebook. The numbers are from the FAA Registry. Gliders, homebuilts, airliners and other aircraft not found in the Bluebook are not included in this study.
 Aircraft Bluebook Marketline
After the revised second quarter GDP estimate came out on Aug. 27, 2010, we updated the GDP graph to include most recent revisions.
CHARTS — MAY 26, 2010
 Used Aircraft Market: This chart displays each model's quarterly value in relationship to its average equipped price at the inception of the aircraft. The study begins in the spring quarter of 1994 and includes the Jet, Turboprop, Multi, Piston and Helicopter. For all charts, the red number indicates the first reporting date after 9-11.
 Jet: The jet chart depicts the average price (in thousands) of the six 1990s jets listed in the box.
 Turboprop: The turboprop chart depicts the average price (in thousands) of a 1985, 1986 and four 1990 turboprops listed in the box.
 Multi: The multi chart depicts the average price (in thousands) of the six multi models listed in the box. Each model’s year will precede the name of the aircraft.
 Piston: The piston chart depicts the average price (in thousands) of the 10 pistons listed in the box. Each model’s year will precede the name of the aircraft.
 Helicopter: The helicopter chart depicts the average price (in thousands) of the six helicopters listed in the box. Each model’s year will precede the name of the aircraft.
 NASDAQ: This ratio scale chart depicts the change for the NASDAQ daily average from quarter to quarter beginning at the end of the first quarter of 1992. Each data point represents the closing daily average on the last trading day of each quarter. This study originates in the first quarter of 1971.
 Aircraft on Registry: The Aircraft on Registry chart depicts the number of aircraft reported in Aircraft Bluebook that are listed on FAA records and considered to be in the U.S. inventory.
 U.S. Real Gross Domestic Product: This graph represents real gross domestic product measured by the U.S. Department of Commerce. Each data point represents the percentage change from the 2005 baseline GDP. The study begins with the second quarter in 2005.
 Single/Multi: The blue line in the Single/Multi chart depicts change-of-ownership data for singles. The black line represents multis.
 Jet/Turboprop/Heli: The black line in the Jet/Turboprop/Heli chart represents change-of-ownership information for jets. The blue line depicts turboprops, and the gray line represents helicopters.
 Total Market: Depicts change-of-ownership data for all aircraft included in the Aircraft Bluebook. The numbers are from the FAA Registry. Gliders, homebuilts, airliners and other aircraft not found in the Bluebook are not included in this study.
CHARTS — FEB. 17, 2010
 Used Aircraft Market: This chart displays each model's quarterly value in relationship to its average equipped price at the inception of the aircraft. The study begins in the spring quarter of 1994 and includes the Jet, Turboprop, Multi, Piston and Helicopter. For all charts, the red number indicates the first reporting date after 9-11.
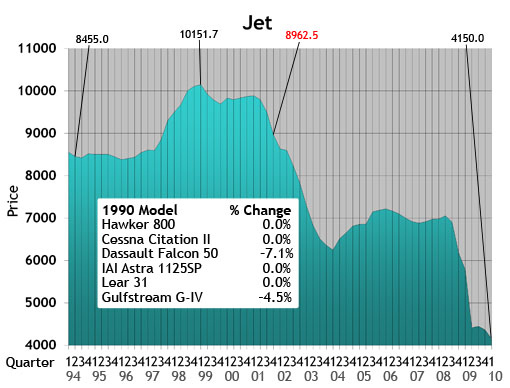 Jet: The jet chart depicts the average price (in thousands) of the six 1990s jets listed in the box.
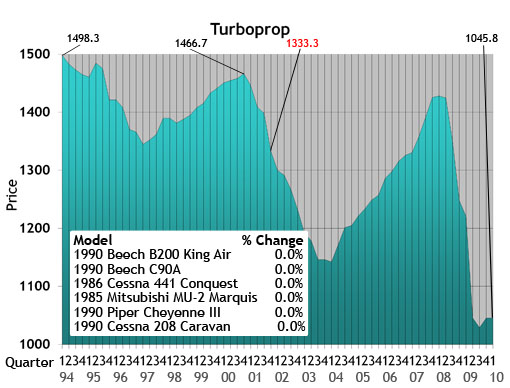 Turboprop: The turboprop chart depicts the average price (in thousands) of a 1985, 1986 and four 1990 turboprops listed in the box.
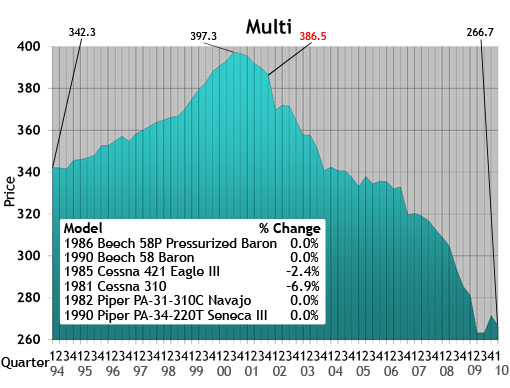 Multi: The multi chart depicts the average price (in thousands) of the six multi models listed in the box. Each model’s year will precede the name of the aircraft.
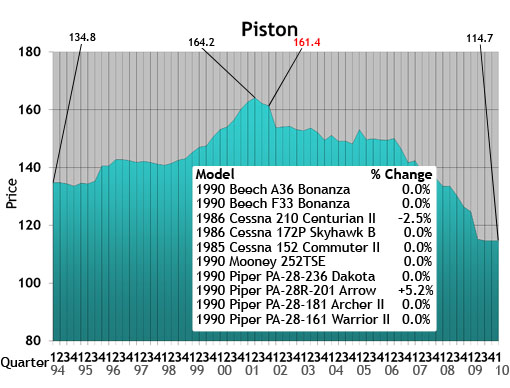 Piston: The piston chart depicts the average price (in thousands) of the 10 pistons listed in the box. Each model’s year will precede the name of the aircraft.
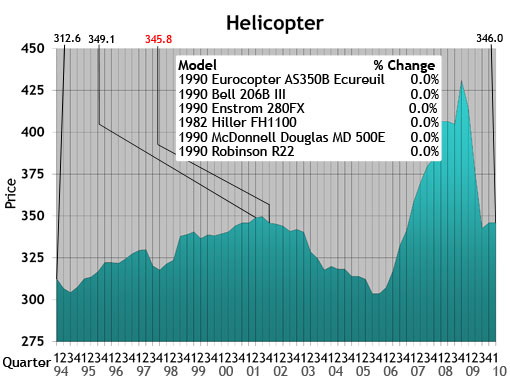 Helicopter: The helicopter chart depicts the average price (in thousands) of the six helicopters listed in the box. Each model’s year will precede the name of the aircraft.
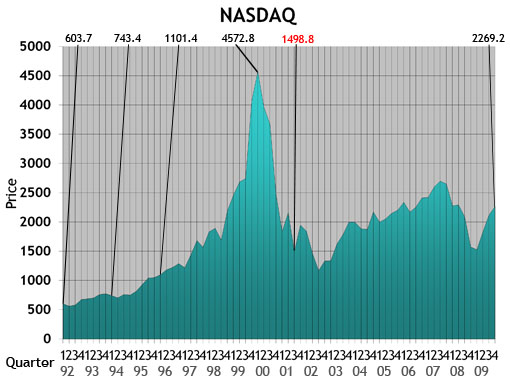 NASDAQ: This ratio scale chart depicts the change for the NASDAQ daily average from quarter to quarter beginning at the end of the first quarter of 1992. Each data point represents the closing daily average on the last trading day of each quarter. This study originates in the first quarter of 1971.
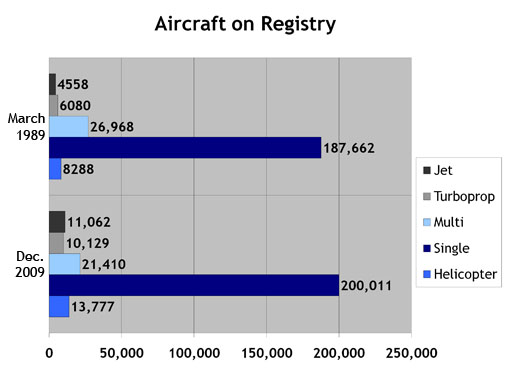 Aircraft on Registry: The Aircraft on Registry chart depicts the number of aircraft reported in Aircraft Bluebook that are listed on FAA records and considered to be in the U.S. inventory.
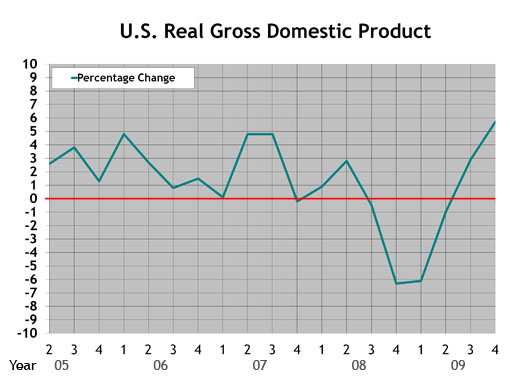 U.S. Real Gross Domestic Product: This graph represents real gross domestic product measured by the U.S. Department of Commerce. Each data point represents the percentage change from the 2005 baseline GDP. The study begins with the second quarter in 2005.
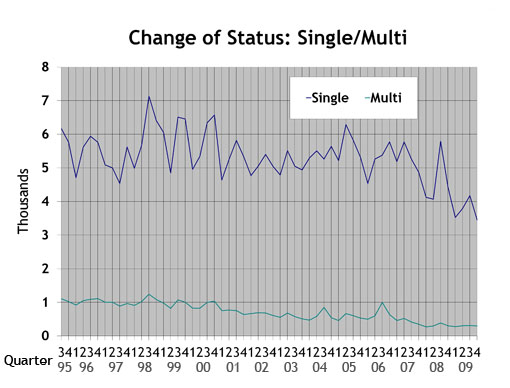 Single/Multi: The blue line in the Single/Multi chart depicts change-of-ownership data for singles. The black line represents multis.
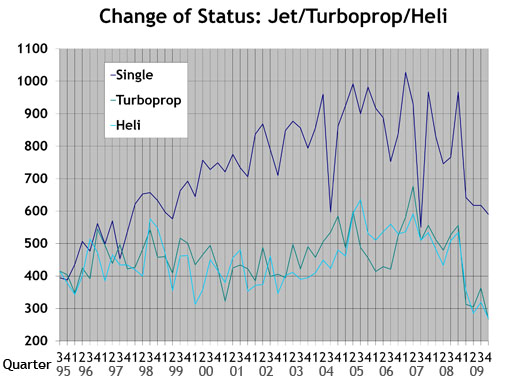 Jet/Turboprop/Heli: The black line in the Jet/Turboprop/Heli chart represents change-of-ownership information for jets. The blue line depicts turboprops, and the gray line represents helicopters.
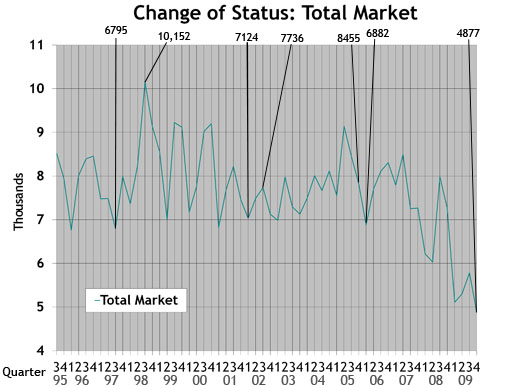 Total Market: Depicts change-of-ownership data for all aircraft included in the Aircraft Bluebook. The numbers are from the FAA Registry. Gliders, homebuilts, airliners and other aircraft not found in the Bluebook are not included in this study.
Charts