tagged  Beech, Bombardier, Cessna, Challenger, Dassault Falcon, helicopter, jet, multi, single, turboprop, used aircraft, values in Newsletter
Newsletter 


by Carl Janssens, ASA | Aircraft Bluebook — Price Digest
Aircraft values reported in the previous quarter were in a spiral dive, but the economy’s pilot now appears to have neutralized the rapid descent.
For the most part, values have arrived at ground level. Inventories have shown signs of stability with little or no growth in units for sale. Other market indicators show signs of neutralization as well. Aircraft dealers and brokers report that interest has increased. Phones are ringing more with potential buyers on the line. Compared to the 2005 baseline real gross domestic product, GDP declined 1.0 percent in the second quarter of 2009 after declining 6.4 percent in the first quarter. These indicators support the signs of neutralization in the marketplace, though the used aircraft market has no reason to rally.
Maybe the market has not yet reached the dawn of a recovery, but the market has absorbed the fallen values. The jet segment is the most volatile portion of the aircraft market. Flight departments that were liquidated are no longer creating a frenzy of drastic value reductions. Manufacturers finding new homes for new aircraft in default maintain nearly full sales values. The only difference is that deposits from contracts in default allow discounts to the new buyers. Once these sales are complete, the discounts will end.
Bluebook-at-a-glance
Increased — 143
Decreased — 49
Stable — 665
Bluebook’s attention has focused on late-model large-cabin new deliveries that may take as long as two years or more for interior completion and delivery. Some of the increase in value can be found in the fall edition of Aircraft Bluebook. Examples include the Bombardier Global family as well as the Challenger 605 and Dassault Falcon 900 and 2000 series.
Bluebook-at-a-glance
Increased — 75
Decreased — 114
Stable — 399
Socata fared better in this reporting period. Sales demonstrated that values were better than previously reported; therefore, stronger values appear in the new release of Bluebook. Turboprop ag planes continue to demonstrate improved values with limited inventories available in the world market. The Piaggio was up 9 percent from the previous quarter as well.
Bluebook-at-a-glance
Increased — 0
Decreased — 110
Stable — 545
For the most part, values remained unchanged for this reporting period in the multipiston category. Nothing increased in value. Most late models held on to their values without loss. Early model Cessnas as well as some Twin Commanders trended downward slightly.
Bluebook-at-a-glance
Increased — 117
Decreased — 220
Stable — 2108
Ag planes kept a positive note in the single category. Select models experienced modest increases. Some of the decreases included American Champions, such as the 8-KCAB, and Beech 35. Both were reported down from the previous quarter. For the most part, however, most single-engine pistons remained steady for this reporting period.
Bluebook-at-a-glance
Increased — 4
Decreased — 828
Stable — 177
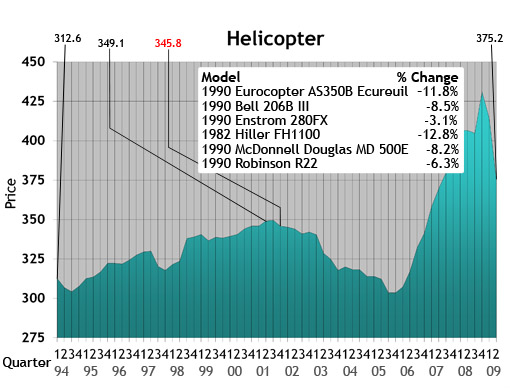
Helicopter values experienced a decline in this quarter. Part of the decline may relate to lower values on earlier models with limited mission capabilities when compared to newer helicopters. Early-model Sikorsky aircraft as well as Bell and Eurocopter models were down. Decreases averaged 8 percent or more. In the piston category, values were lower, too.
Please contact Aircraft Bluebook if you have any specific concern in a particular aircraft market. We will be happy to share with you the most up-to-date information available for your market segment. Call us toll free at 877-531-1450 or direct at 913-967-1913.
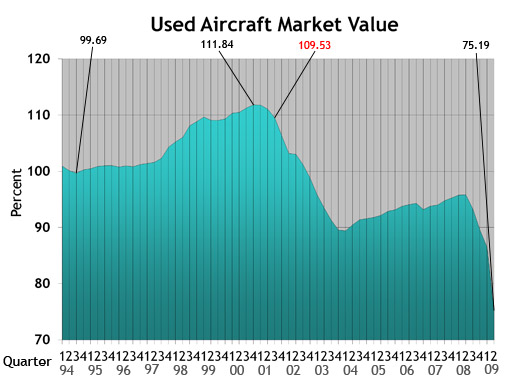
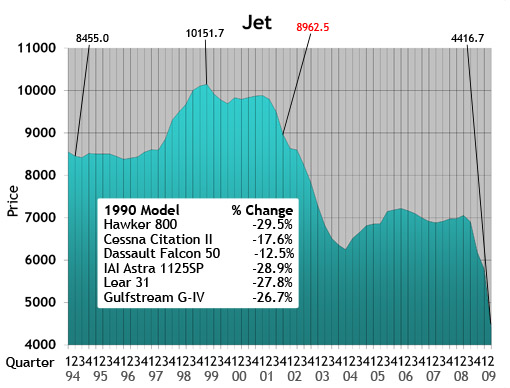
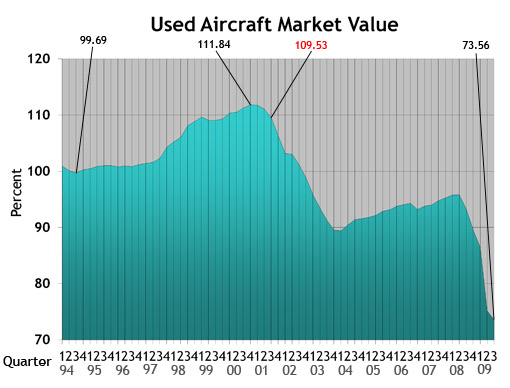 Used Aircraft Market: This chart displays each model's quarterly value in relationship to its average equipped price at the inception of the aircraft. The study begins in the spring quarter of 1994 and includes the Jet, Turboprop, Multi, Piston and Helicopter. For all charts, the red number indicates the first reporting date after 9-11.
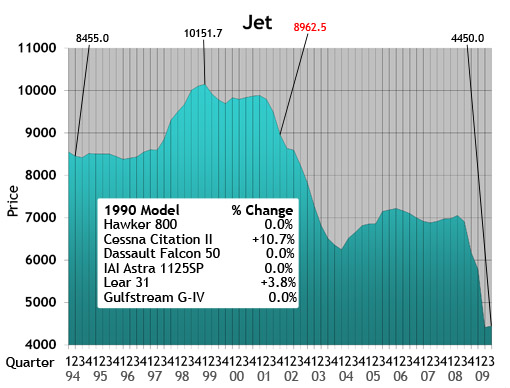 Jet: The jet chart depicts the average price (in thousands) of the six 1990s jets listed in the box.
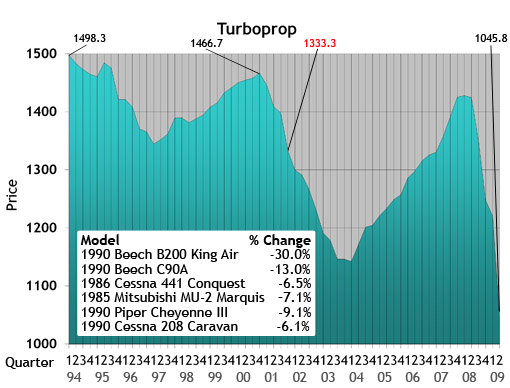
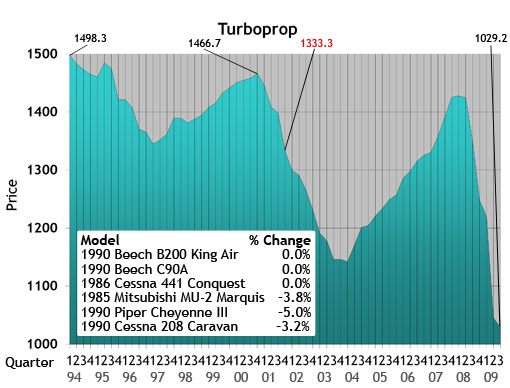 Turboprop: The turboprop chart depicts the average price (in thousands) of a 1985, 1986 and four 1990 turboprops listed in the box.
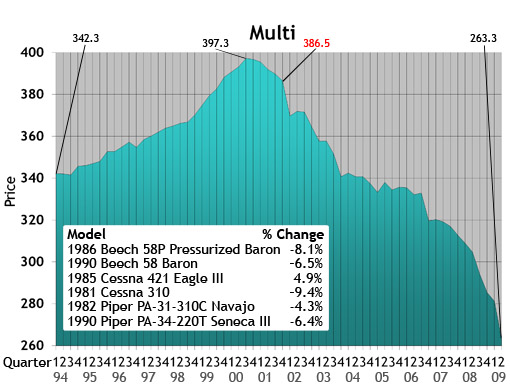
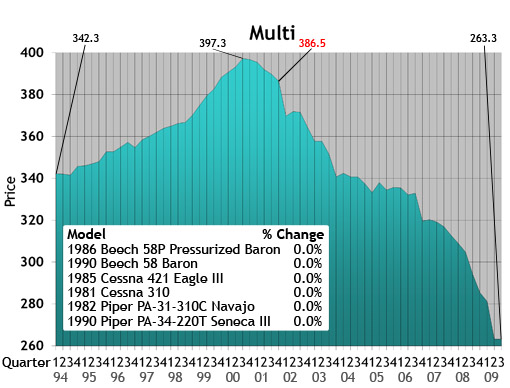 Multi: The multi chart depicts the average price (in thousands) of the six multi models listed in the box. Each model’s year will precede the name of the aircraft.
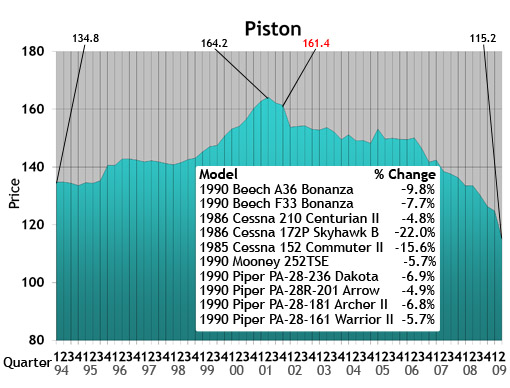
 Piston: The piston chart depicts the average price (in thousands) of the 10 pistons listed in the box. Each model’s year will precede the name of the aircraft.
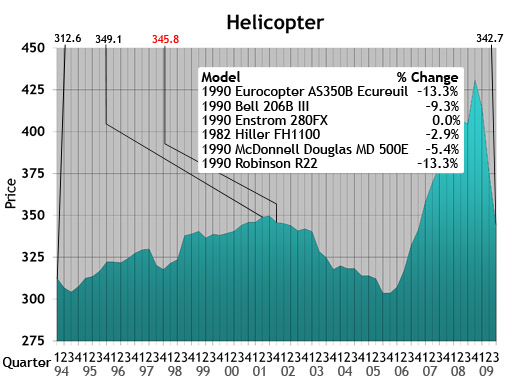 Helicopter: The helicopter chart depicts the average price (in thousands) of the six helicopters listed in the box. Each model’s year will precede the name of the aircraft.
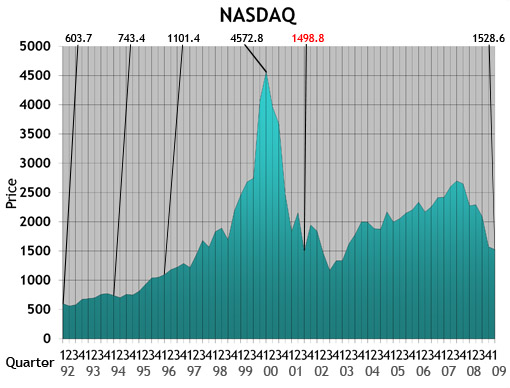
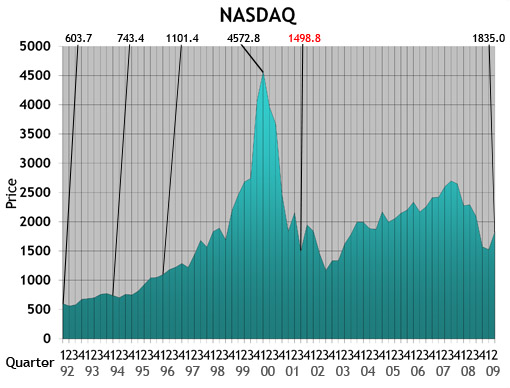 NASDAQ: This ratio scale chart depicts the change for the NASDAQ daily average from quarter to quarter beginning at the end of the first quarter of 1992. Each data point represents the closing daily average on the last trading day of each quarter. This study originates in the first quarter of 1971.
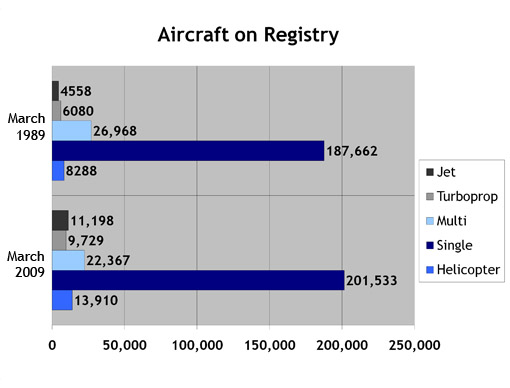
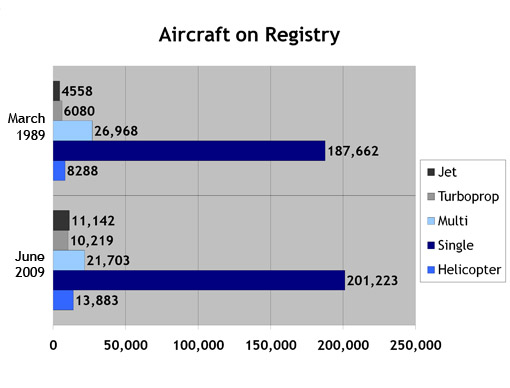 Aircraft on Registry: The Aircraft on Registry chart depicts the number of aircraft reported in Aircraft Bluebook that are listed on FAA records and considered to be in the U.S. inventory.
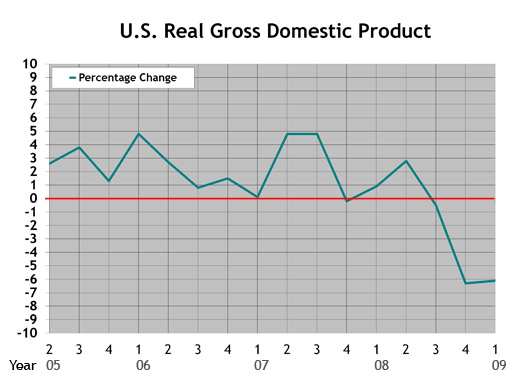
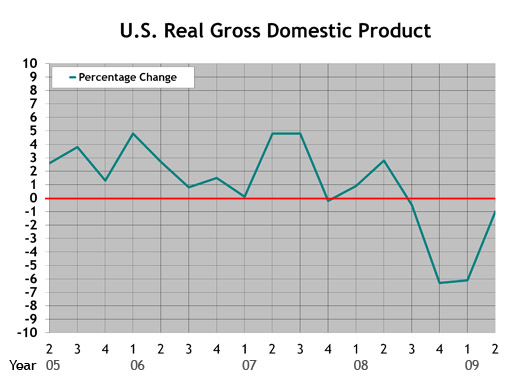 U.S. Real Gross Domestic Product: This graph represents real gross domestic product measured by the U.S. Department of Commerce. Each data point represents the percentage change from the 2005 baseline GDP. The study begins with the second quarter in 2005.
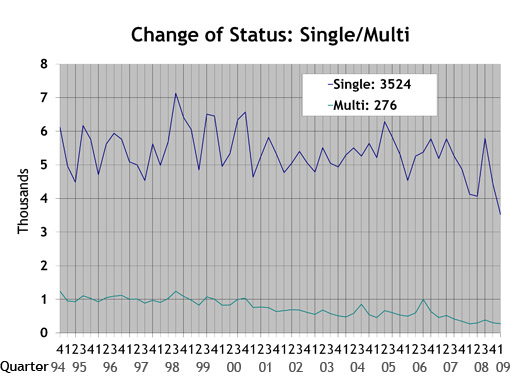
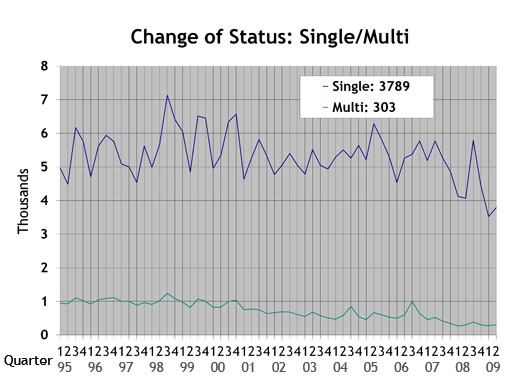 Single/Multi: The blue line in the Single/Multi chart depicts change-of-status data for singles. The green line represents multis.
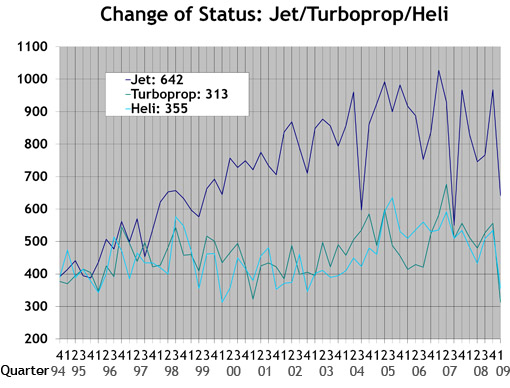
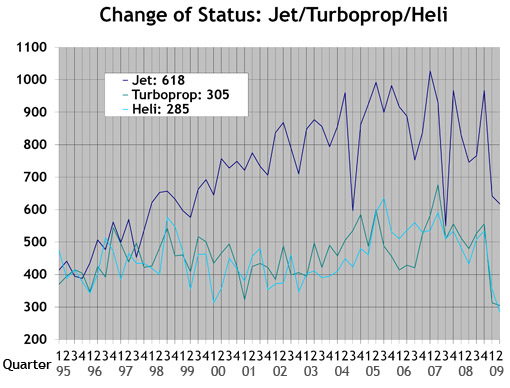 Jet/Turboprop/Heli: The dark blue line in the Jet/Turboprop/Heli chart represents change-of-status information for jets. The green line depicts turboprops, and the light blue line represents helicopters.
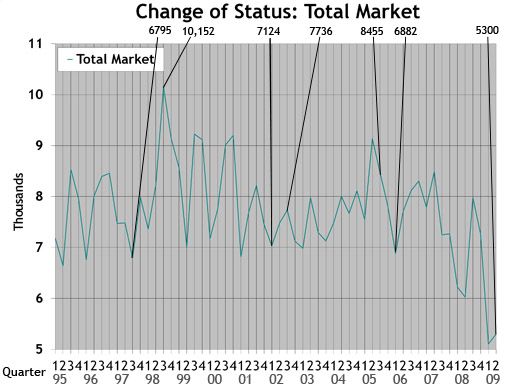 Total Market: Depicts change-of-status data for all aircraft included in the Aircraft Bluebook. The numbers are from the FAA Registry. Gliders, homebuilts, airliners and other aircraft not found in the Bluebook are not included in this study.
by Carl Janssens, ASA | Aircraft Bluebook — Price Digest
With the warm rays of the summer sun approaching, the current economic condition of values for pre-owned aircraft is anything but sunny. The aircraft market has suffered its greatest loss in value since the corporate jet became a part of American enterprise with its introduction in the 1960s. As with any commodity traded in a free market, one that is not restricted or regulated by government controls on pricing, the core element of value is in human perception. For aircraft values, perception of worth is always on the leading edge of value.
The perception of value has been embedded in the general and corporate aviation market since its beginnings. Reflect for a moment on the case of a damage event to an aircraft. At the mere mention of the word damage, the market reacts in an aggressively negative manner. Depending on the market conditions and the nature and cure of the damage, all of these variables will impact perception of value. In an average and stable market, a whole tier of potential buyers will not even consider an aircraft with a damage incident. They just don’t want to deal with the stigma and risk in value for owning such an aircraft when there are normally other similar, undamaged aircraft available for ownership as well. And those knowledgeable buyers who do consider the prospect of ownership of such an aircraft with damage history will want to be compensated for their risk, usually in the form of a discount in price in an average market. An aircraft cured from a damage incident will be restored to a condition of airworthiness that is equal to if not better than its original condition prior to the damage incident. It is not a question of condition or safety but only of market perception that will negatively impact value.
Such is the case in the current state of our economy. The economy has been damaged. No need to point blame anywhere. We all are members of the same human race. Embedded in this damaged economy is the aircraft market. With credit scrutinized and inventory overabundant, the free will and intellect of a rational human being (aka common sense) would naturally offer something significantly less for an aircraft. The market conditions themselves yield to a severely reduced perception of value.
On the sunny side, perception is fluid. The dynamics of today’s market are subject to change. Heads up for buyers: Bargain values may not get any better. Now is the time to buy.
Bluebook-at-a-glance
Increased — 0
Decreased — 781
Stable — 26
Long-range business jets, such as the Bombardier Global Express, Challenger, Dassault Falcon 900/2000/50 series and Gulfstream G-IV/V/450/550, all indicated downward values in the double-digit percentage column. The same value losses also occurred in the mid-cabin series. Cessna Citation X values were down in the $1 million. The Hawker 800 series and the Lear 60/45 series also were not able to report any stability in value. Reductions in value numbered in the millions of dollars.
Bluebook-at-a-glance
Increased — 3
Decreased — 485
Stable — 95
Though still negative, the Beechcraft families of King Airs experienced less dramatic value adjustments. The King Air 350 was down an average of $600,000 compared to the previous quarter. Similar percentage drops in value were also noted in the King 200 and 90 series. The Pilatus PC-12 was generally down $300,000. The Socata 700 series was off $200,000.
Bluebook-at-a-glance
Increased — 0
Decreased — 648
Stable — 6
For the most part, values dropped across the board in the twin-piston market. Later-model Beech Barons and Cessna 421s were off $20,000. Earlier models were down $10,000. The Diamond Twin Star saw a $50,000 loss in value. The factory-equipped and unresolved Thielert engines could cause further diminished values. Piper Seneca Vs were down in the $40,000 range, and earlier models were generally down $10,000.
Bluebook-at-a-glance
Increased — 0
Decreased — 1953
Stable — 479
Agriculture planes continue to hold value. Early models, late models, pistons and turbines all held value mainly due to the higher demand for these aircraft. American Champion aircraft were down anywhere from $1,000 for some early models to the $5000 range for later models. For 1995 and later models, the Beechcraft Bonanza A36s were down $30,000 or more. Late-model Cessna 172s, 182s and 206s all experienced reductions in the reported average retail column in the $10,000-to-$20,000 range. The former Columbia also saw value decreases consistent with other late-model Cessna singles. Diamond Aircraft were no exception. Average retail values were down an average of $10,000.
Bluebook-at-a-glance
Increased — 4
Decreased — 772
Stable — 228
Helicopters continue to fair the economic storm better than fixed wings. Although average retail values were in the negative column for a majority of models, this market segment continued to show endurance as late-model, equipped and market-priced ships continue to sell. For the most part, values were generally off no more than 5 percent to 10 percent when compared to the previous quarter. The Augusta 109 was down no more than 9 percent in later models. Bell 430s were off $100,000. The Eurocopter AS350 was down $100,000 while the Eurocopter EC120 was down $50,000. Robinsons were off 5 to 8 percent. Sikorsky was down 5 percent in some year models when compared to last quarter.
A gross domestic product graph replaces the former exports graph.
Please contact Aircraft Bluebook–Price Digest if you have any specific concern in a particular aircraft market. Call toll-free at 877-531-1450 or direct at 913-967-1913.
Used Aircraft Market: This chart displays each model's quarterly value in relationship to its average equipped price at the inception of the aircraft. The study begins in the spring quarter of 1994 and includes the Jet, Turboprop, Multi, Piston and Helicopter. For all charts, the red number indicates the first reporting date after 9-11.
Jet: The jet chart depicts the average price (in thousands) of the six 1990s jets listed in the box.
Turboprop: The turboprop chart depicts the average price (in thousands) of a 1985, 1986 and four 1990 turboprops listed in the box.
Multi: The multi chart depicts the average price (in thousands) of the six multi models listed in the box. Each model’s year will precede the name of the aircraft.
 Piston: The piston chart depicts the average price (in thousands) of the 10 pistons listed in the box. Each model’s year will precede the name of the aircraft.
Helicopter: The helicopter chart depicts the average price (in thousands) of the six helicopters listed in the box. Each model’s year will precede the name of the aircraft.
NASDAQ: This ratio scale chart depicts the change for the NASDAQ daily average from quarter to quarter beginning at the end of the first quarter of 1992. Each data point represents the closing daily average on the last trading day of each quarter. This study originates in the first quarter of 1971.
 Aircraft on Registry: The Aircraft on Registry chart depicts the number of aircraft reported in Aircraft Bluebook that are listed on FAA records and considered to be in the U.S. inventory.
U.S. Real Gross Domestic Product: This graph represents real gross domestic product measured by the U.S. Department of Commerce. Each data point represents the percentage change from the 2005 baseline GDP. The study begins with the second quarter in 2005.
Single/Multi: The blue line in the Single/Multi chart depicts change-of-status data for singles. The green line represents multis.
Jet/Turboprop/Heli: The dark blue line in the Jet/Turboprop/Heli chart represents change-of-status information for jets. The green line depicts turboprops, and the light blue line represents helicopters.

Total Market: Depicts change-of-status data for all aircraft included in the Aircraft Bluebook. The numbers are from the FAA Registry. Gliders, homebuilts, airliners and other aircraft not found in the Bluebook are not included in this study.
Aircraft Bluebook–Price Digest will be in Fort Lauderdale, Fla., April 22-24 for the National Aircraft Finance Association meeting. Carl Janssens, ASA, will be a panelist at the following workshop:
April 23, 1-5 p.m.
Breakout Session: Pistons and Turboprops
Workshop 3: Trends and Evaluations
Panelists:
Carl Janssens, Aircraft Bluebook
Fletcher Aldredge, Aircraft Value Reference (VREF)
Ken Dufour, Aviation Management Consulting, Inc.
Topics:
Effects of Current Economy on Values, Outlooks & Trends
Carl will be able to offer some insight into the latest aircraft values and what to expect in the summer issue of Aircraft Bluebook.