in  Charts
Charts 


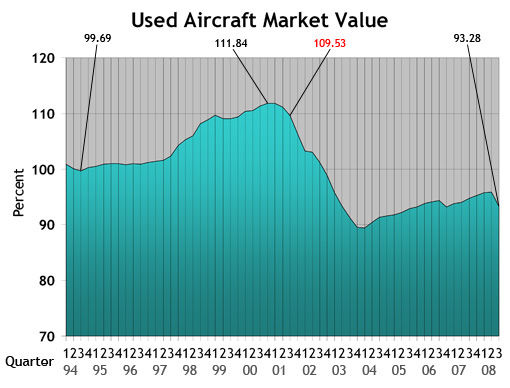
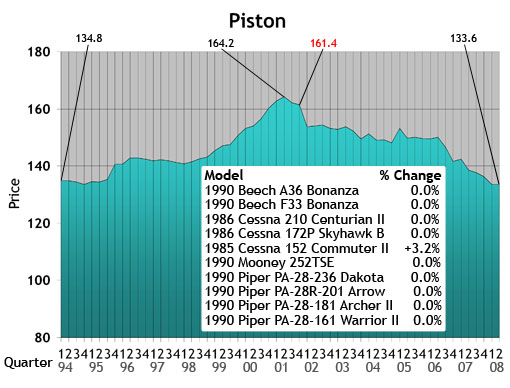
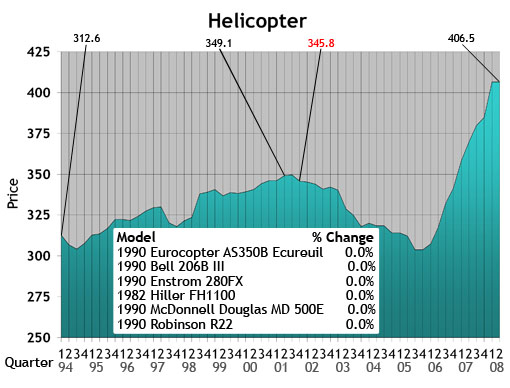
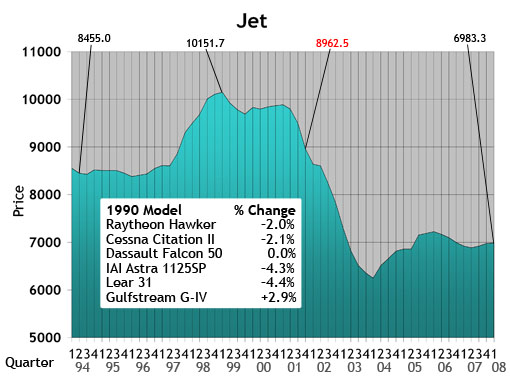
Used Aircraft Market: This chart displays each model's quarterly value in relationship to its average equipped price at the inception of the aircraft. The study begins in the spring quarter of 1994 and includes the Jet, Turboprop, Multi, Piston and Helicopter. For all charts, the red number indicates the first reporting date after 9-11.
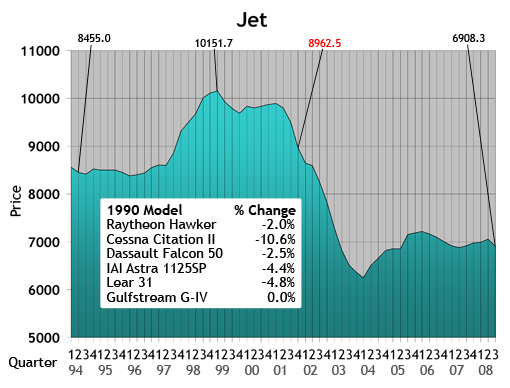
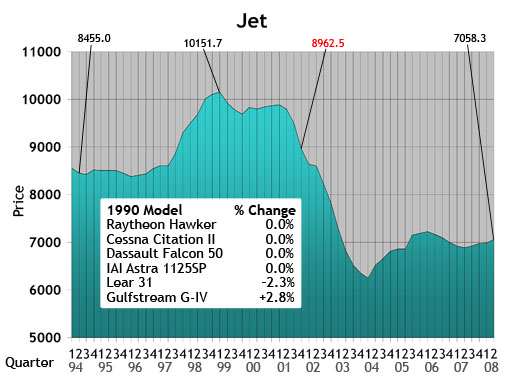
Jet: The jet chart depicts the average price (in thousands) of the six 1990s jets listed in the box.
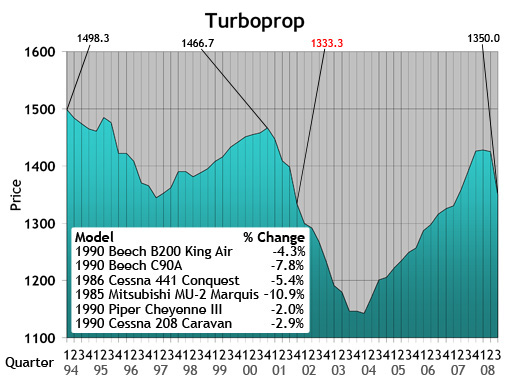
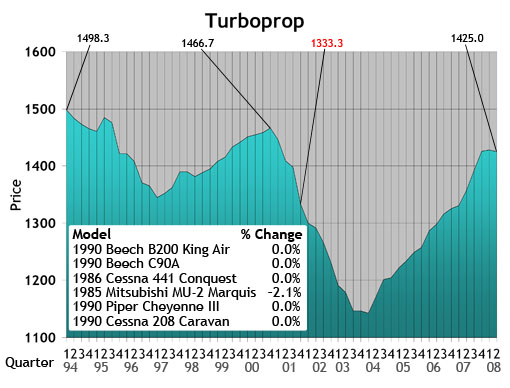
Turboprop: The turboprop chart depicts the average price (in thousands) of a 1985, 1986 and four 1990 turboprops listed in the box.
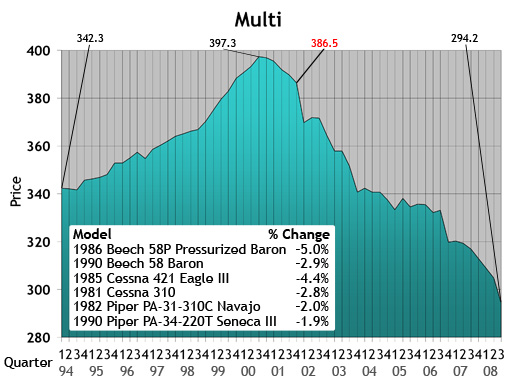
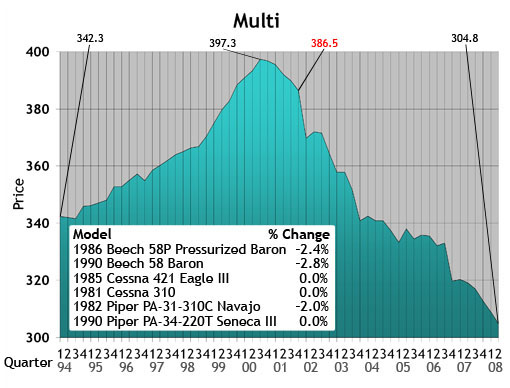
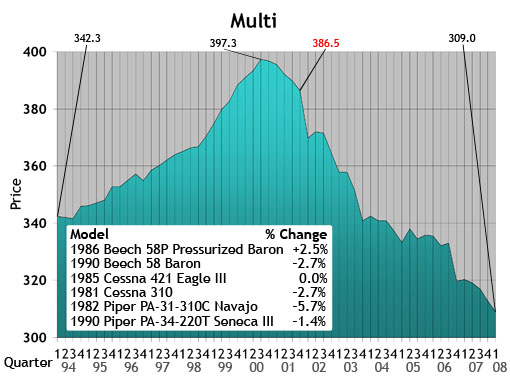
Multi: The multi chart depicts the average price (in thousands) of the six multi models listed in the box. Each model’s year will precede the name of the aircraft.
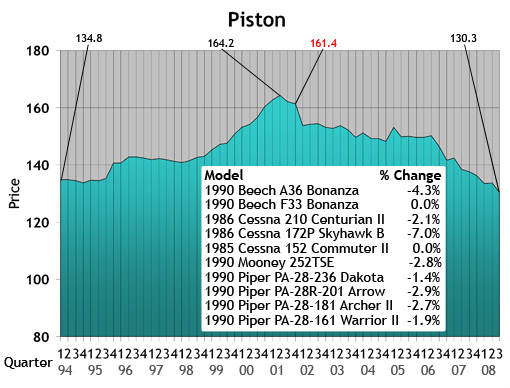
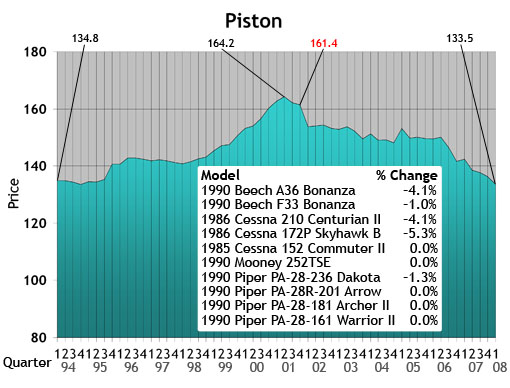
Piston: The piston chart depicts the average price (in thousands) of the 10 pistons listed in the box. Each model’s year will precede the name of the aircraft.
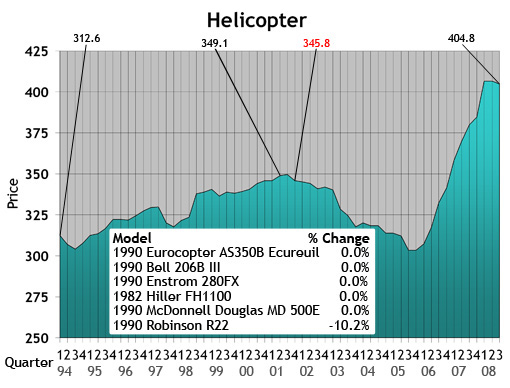
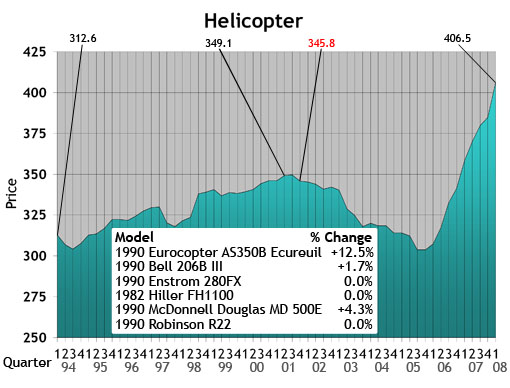
Helicopter: The helicopter chart depicts the average price (in thousands) of the six helicopters listed in the box. Each model’s year will precede the name of the aircraft.
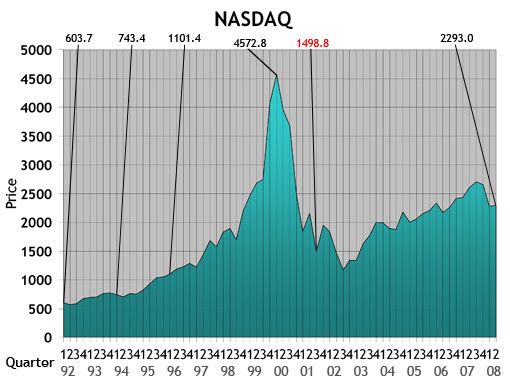
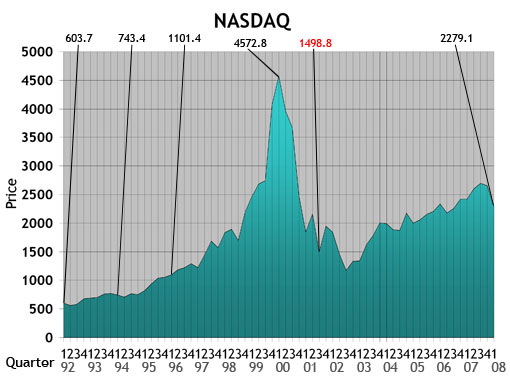
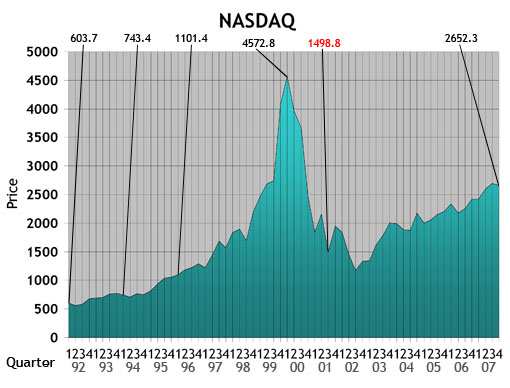
NASDAQ: This ratio scale chart depicts the change for the NASDAQ daily average from quarter to quarter beginning at the end of the first quarter of 1992. Each data point represents the closing daily average on the last trading day of each quarter. This study originates in the first quarter of 1971.
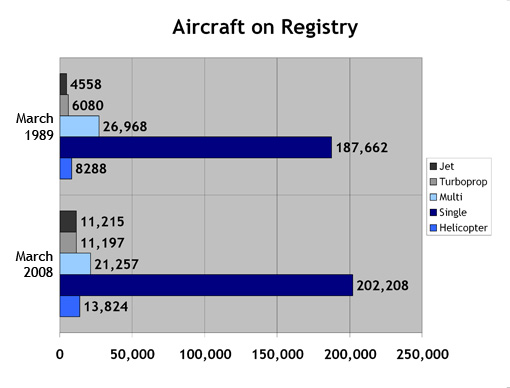
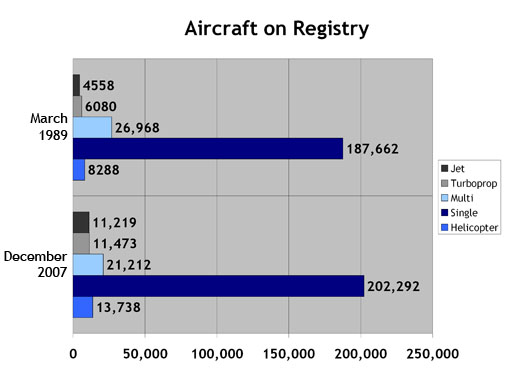
Aircraft on Registry: The Aircraft on Registry chart depicts the number of aircraft reported in Aircraft Bluebook that are listed on FAA records and considered to be in the U.S. inventory.
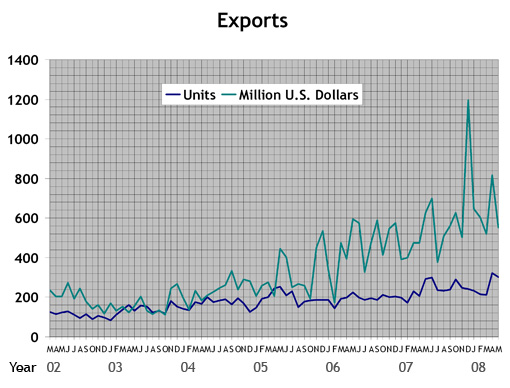
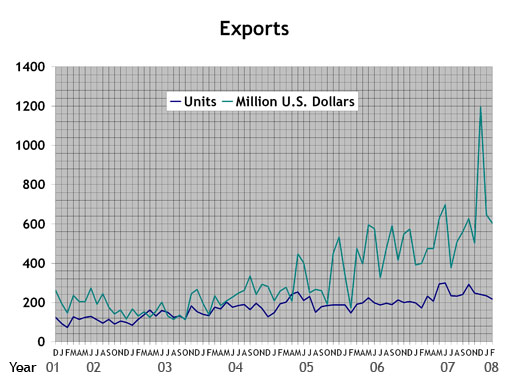
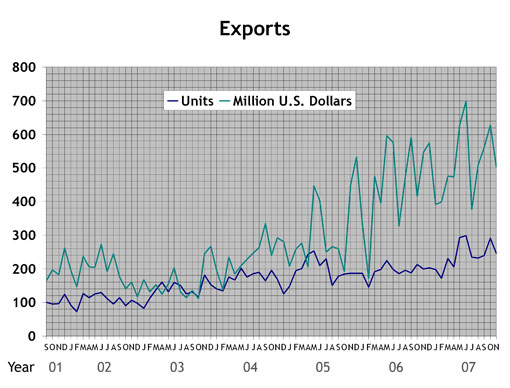
Export Data: These numbers include both airplanes and helicopters. The numbers do not include aircraft that have empty weights in excess of 33,069 lbs.
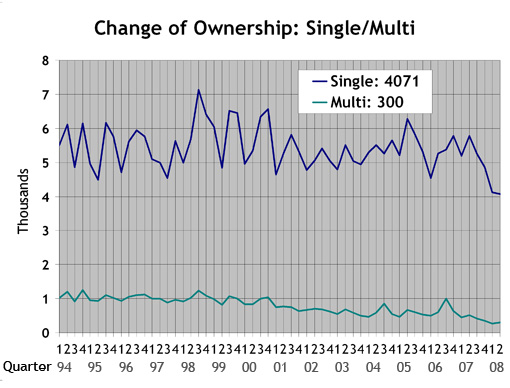
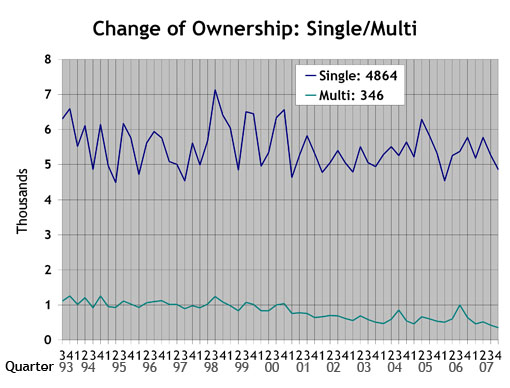
Single/Multi: The blue line in the Single/Multi chart depicts change-of-ownership data for singles. The green line represents multis.
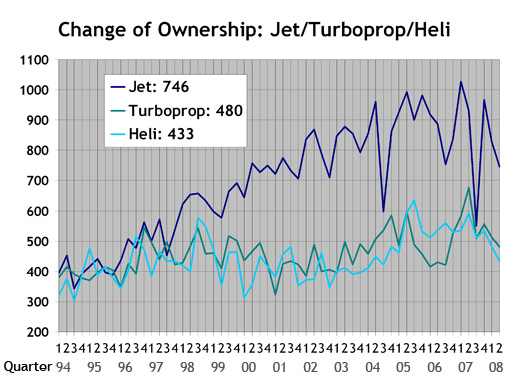
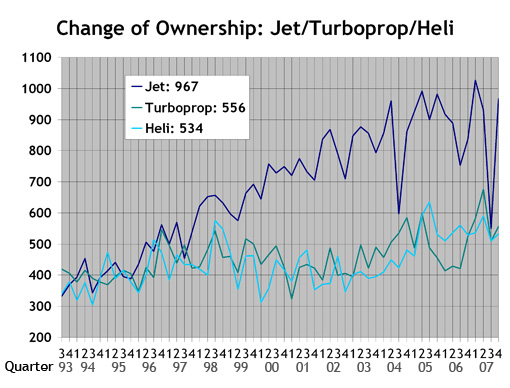
Jet/Turboprop/Heli: The dark blue line in the Jet/Turboprop/Heli chart represents change-of-ownership information for jets. The green line depicts turboprops, and the light blue line represents helicopters.
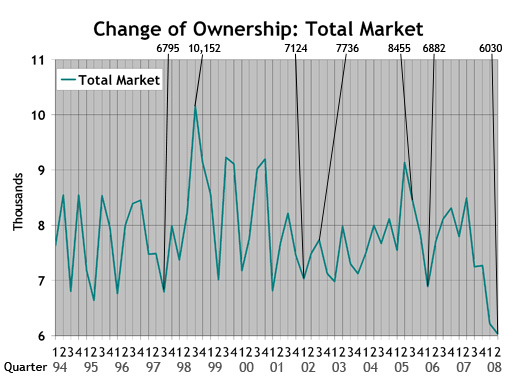
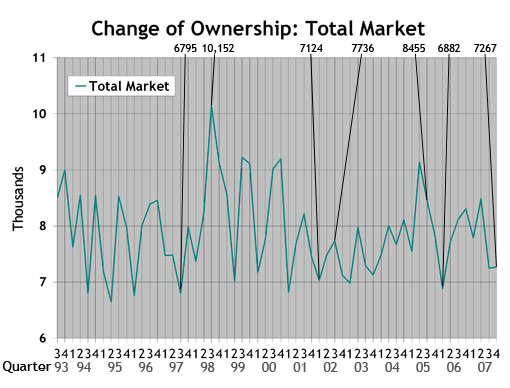
Total Market: Depicts change-of-ownership data for all aircraft included in the Aircraft Bluebook. The numbers are from the FAA Registry. Gliders, homebuilts, airliners and other aircraft not found in the Bluebook are not included in this study.
Charts by Carl Janssens, ASA | Aircraft Bluebook – Price Digest
Seems like everywhere one turns these days, it is easy to cue in on the worst-case scenario revolving around the depressed U.S. real estate market and the subprime mortgage scandal. Still, by official definition, the United States does not fit the mold that would indicate an economic recession has occurred. As Johnnie Cochran, the well-known defense lawyer once said in a high-profile trial, “If the glove doesn’t fit, you must acquit.” His statement would fit well with those who want to doom our economy to a recession.
Sure, the U.S. economy is currently working through some uncertain economic woes, but keep in mind these concerns will mend in time. This is easy to predict because the United States is still the land of opportunity and resources. And every time we pull a U.S. dollar bill out of our pocket, we are reminded that the nation recognizes a higher authority in its commerce. Printed on every U.S. dollar bill in any denomination: “In God We Trust.”
Bluebook-at-a-glance
Increased — 100
Decreased — 130
Stable — 565
New orders for corporate jets are at an all-time high. There are no signs of a slowdown. Orders are not being dropped as waiting lists for new deliveries continue to grow at record paces. The aircraft market does not reflect the uncertainties of the general economy. Why is this? As one aircraft dealer summarized at the National Aircraft Resale Association meeting in May: “Think of the industrialization the United States experienced last century. That’s what the rest of the world is going through now.”
For pre-owned jets, it has been business as usual in this segment reported by Aircraft Bluebook. Some of the notable changes in this market segment include early-model Cessna 500 series with $50,000 gains after a long run of nearly no movement. In the larger-cabin segment, Falcon 2000s generally were up another $300,000. There is no inventory for the newest Falcon, the 7X, so who knows what the checkbook will reveal should one come up for sale?
Ten-year-old and newer aircraft still continue to sell at record paces with minimal time on market.
Bluebook-at-a-glance
Increased — 44
Decreased— 65
Stable — 506
As one aircraft dealer noted, the current turboprop market is reflecting a normal economy. Inventories are stable, and interest in acquisitions remains steady. Aircraft Bluebook noted this stability. Prices did not show much activity moving in either direction in this reporting period. Of the few aircraft models that did see positive increases in value, the list was pretty limited to predictable models. Some King Airs, P180s and the PC12 all contributed. Declines included the MU-2.
Bluebook-at-a-glance
Increased — 4
Decreased — 135
Stable — 529
The multi market continued to be predictable. Well-equipped, low-time, late-model aircraft do not stay on the market long when offered in the resale arena. The same held true for earlier models that have low time and have recently been restored with upgraded avionics. The Aerostar was the only aircraft with noted increases, and even those were modest in the $5000-$10,000 range. In the negative, select models across the board were noted down several thousand dollars as well. Again, the majority of this market segment remained stable.
Bluebook-at-a-glance
Increased — 223
Decreased — 148
Stable — 2033
The single market continued to hold its own during this reporting period. Several dealers reported record sales activity during the first quarter of 2008. With the single market most exposed to the effects of an economy that is slowing down, sales continued. Again, with the little movement in values reported by Aircraft Bluebook, gains and losses were minimal when compared to the previous quarter. The majority of the market held steady.
Bluebook-at-a-glance
Increased — 228
Decreased — 26
Stable — 676
Helicopter values remained strong during the first quarter of 2008. With manufacturers continuing to focus primarily on government contracts, the waiting list for new acquisitions continued to grow. Late-model helicopters with low component times are selling well. For turbine helicopters tracked by Aircraft Bluebook, gains were in the $50,000-$100,000 range with some of the elite twin-turbine class gaining several hundred thousand dollars when compared to the previous reporting period. Values for some Robinson models were down slightly from last quarter.
Newsletter 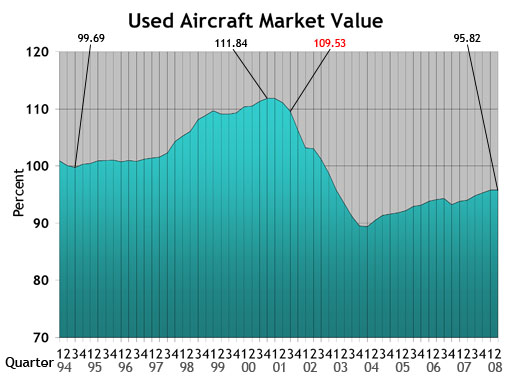
Used Aircraft Market: This chart displays each model's quarterly value in relationship to its average equipped price at the inception of the aircraft. The study begins in the spring quarter of 1994 and includes the Jet, Turboprop, Multi, Piston and Helicopter. For all charts, the red number indicates the first reporting date after 9-11.
Jet: The jet chart depicts the average price (in thousands) of the six 1990s jets listed in the box.
Turboprop: The turboprop chart depicts the average price (in thousands) of a 1985, 1986 and four 1990 turboprops listed in the box.
Multi: The multi chart depicts the average price (in thousands) of the six multi models listed in the box. Each model’s year will precede the name of the aircraft.
Piston: The piston chart depicts the average price (in thousands) of the 10 pistons listed in the box. Each model’s year will precede the name of the aircraft.
Helicopter: The helicopter chart depicts the average price (in thousands) of the six helicopters listed in the box. Each model’s year will precede the name of the aircraft.
NASDAQ: This ratio scale chart depicts the change for the NASDAQ daily average from quarter to quarter beginning at the end of the first quarter of 1992. Each data point represents the closing daily average on the last trading day of each quarter. This study originates in the first quarter of 1971.

Aircraft on Registry: The Aircraft on Registry chart depicts the number of aircraft reported in Aircraft Bluebook that are listed on FAA records and considered to be in the U.S. inventory.
Export Data: These numbers include both airplanes and helicopters. The numbers do not include aircraft that have empty weights in excess of 33,069 lbs.
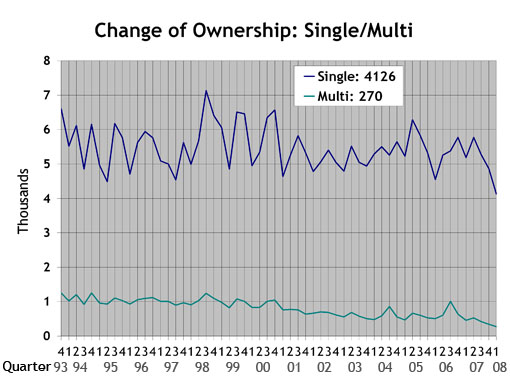
Single/Multi: The blue line in the Single/Multi chart depicts change-of-ownership data for singles. The green line represents multis.
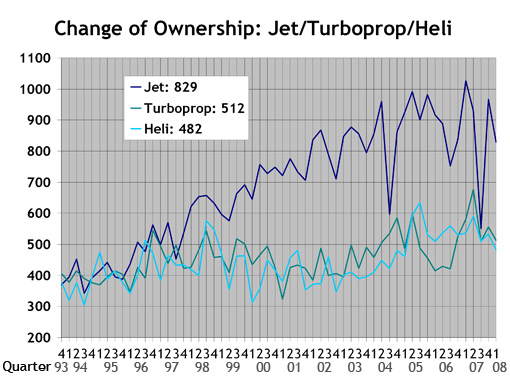
Jet/Turboprop/Heli: The dark blue line in the Jet/Turboprop/Heli chart represents change-of-ownership information for jets. The green line depicts turboprops, and the light blue line represents helicopters.
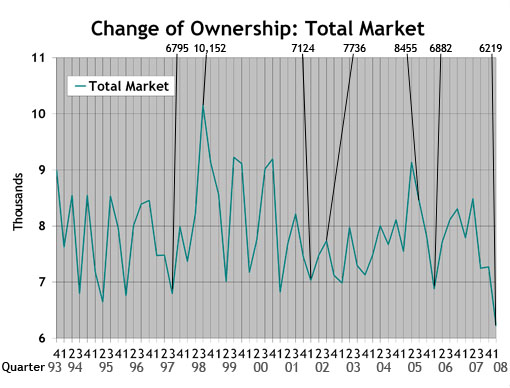
Total Market: Depicts change-of-ownership data for all aircraft included in the Aircraft Bluebook. The numbers are from the FAA Registry. Gliders, homebuilts, airliners and other aircraft not found in the Bluebook are not included in this study.
Charts by Carl Janssens, ASA | Aircraft Bluebook – Price Digest
As the story goes, one day Chicken Little was walking through the woods when an acorn fell on his head. Accordingly, he assumed the sky was falling. Thus, Chicken Little initiated a media blitz to warn the government (in this case the king) of the impending doom. There are some good endings and not-so-good endings to this fairy tale, but the messenger, Chicken Little, and the message of impending doom have remained consistent.
What do Chicken Little and our current economic news have in common? Both are reporting bad news based on kerplunks. Both appear to be promoting a worst-case scenario without examining all of the facts that impact each environment. Hysteria is the catalyst of chaos.
To date, with the global economy in bloom, back orders for new large-cabin long-range aircraft continue to extend out 60 months or more. Try to find a good deal on an existing G-V, Global Express or 900EX. Expect to pay a premium price. And don’t expect any breaks if you are trying to find the same on the commercial side either. Late-model 737s and A320s are selling with high values as well.
The world is indeed changing, and the U.S. economy is leading the charge. But the U.S. economy is no longer in a stand-alone environment. Change is necessary for growth. The opportunity for growth far exceeds the potential for failure. Business aviation is a key link in this process. Contrary to the report from Chicken Little, the sky is not falling. For aircraft sales, business is good, and the sky is blue.
Bluebook-at-a-glance
Increased — 56
Decreased — 394
Stable — 338
You can’t hit a home run every time at bat. Sooner or later, the ball will drop in the outfield for a single. So it is with the Bluebook-at-a-glance numbers for jets for this reporting period. In the winning column, late-model light jets such as the Cessna Citation Jet 525 series increased in value when compared to the previous quarter. The same held true for select large-cabin jets as in the case of the G-IV showing $500,000 gains. Change of ownership reported by the FAA for U.S. jet aircraft reported in Aircraft Bluebook increased substantially when compared to the previous quarter.
The majority of the jet market reported in Bluebook remained either stable or demonstrated some decline. Keep in mind values have been reported at their highest levels since 9/11, and sooner or later, interpretation of value based on condition, sales and available inventory will be on the soft side. Don’t think there is a recession. Like the stock market, the jet market is just as fluid. Consider a 10-year-old aircraft such as the Citation VII. A well-equipped and well- maintained nine- to 10-year-old VII with excellent P&I and at least average airframe time is selling in the $7 million range. In a market thought to be a bit soft, the VIIs have remained consistent with available aircraft for sale over the past year with competitive interest for this aircraft. However, the VIIs are down $100,000 from last quarter to more accurately represent time and condition using Bluebook methodology.
Bluebook-at-a-glance
Increased — 77
Decreased — 121
Stable — 415
Turboprops tracked by Aircraft Bluebook remained stable for yet another quarter. Few experienced increases in reported values over the previous reporting period. Declines in value were noted with late-model King Air 350s, the Piaggio P-180 and the Socata TBM series. Overall, the turboprop market remained stable with the majority of aircraft values remaining unchanged for the current reporting cycle. For U.S. activity over the previous quarter, the FAA reported a 10 percent increase in change of ownership, which indicates a healthy market. Bluebook subscribers had nothing negative to report. Business was good, and interest in acquisitions remains high in this market.
Bluebook-at-a-glance
Increased — 25
Decreased — 298
Stable — 344
There were no surprises in the multi-engine market tracked by the Aircraft Bluebook. The few gains in values included Diamond Twin Stars, Cessna 414As and Beech P58 Barons. On the negative side, overall values diminished generally in the $5,000 range. Time and condition play a significant role in earlier model years. Overall, this market segment was not as active. The FAA reported change of ownership down approximately 15 percent from the previous reporting period. Still, the majority of aircraft in this category remained stable for yet another quarter.
Bluebook-at-a-glance
Increased — 136
Decreased — 717
Stable — 1548
More than half of the single-engine pistons tracked by Aircraft Bluebook remained stable. There were a few gains noted: Piston Ag planes were in the positive value range. Select early-model Mooneys and Pipers also demonstrated slight increases. In the negative column, decreases in value were generally limited to $5,000 or less. With available inventories of aircraft making this a buyer’s market, values are generally expected to decline.
Bluebook-at-a-glance
Increased — 555
Decreased — 13
Stable — 354
Global need for helicopters has kept this market segment robust. Across the board, just about every turbine helicopter reported in the Aircraft Bluebook has demonstrated increases in value or has remained stable when compared to the previous quarter. There is an all-time high need for well-equipped late-model helicopters that cannot be fulfilled. Time, equipment and condition play significant roles in determining value. If dealing with an in-demand model, do not think too long. Someone else on the planet will buy it without blinking an eye.
Please stop by and visit us if you are attending EBACE 2008. We will be located with AC-U-KWIK in booth No. 405. We look forward to visiting with you.
Newsletter 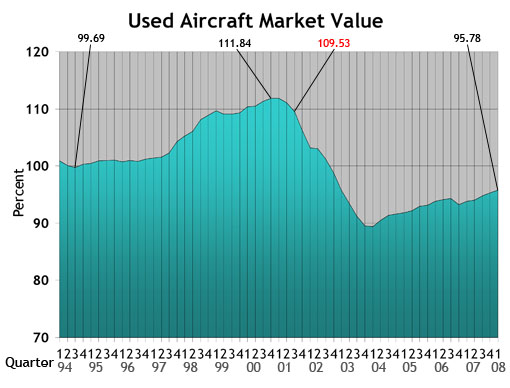
Used Aircraft Market: This chart displays each model's quarterly value in relationship to its average equipped price at the inception of the aircraft. The study begins in the spring quarter of 1994 and includes the Jet, Turboprop, Multi, Piston and Helicopter. For all charts, the red number indicates the first reporting date after 9-11.
Jet: The jet chart depicts the average price (in thousands) of the six 1990s jets listed in the box.

Turboprop: The turboprop chart depicts the average price (in thousands) of a 1985, 1986 and four 1990 turboprops listed in the box.
Multi: The multi chart depicts the average price (in thousands) of the six multi models listed in the box. Each model’s year will precede the name of the aircraft.
Piston: The piston chart depicts the average price (in thousands) of the 10 pistons listed in the box. Each model’s year will precede the name of the aircraft.
Helicopter: The helicopter chart depicts the average price (in thousands) of the six helicopters listed in the box. Each model’s year will precede the name of the aircraft.
NASDAQ: This ratio scale chart depicts the change for the NASDAQ daily average from quarter to quarter beginning at the end of the first quarter of 1992. Each data point represents the closing daily average on the last trading day of each quarter. This study originates in the first quarter of 1971.
Aircraft on Registry: The Aircraft on Registry chart depicts the number of aircraft reported in Aircraft Bluebook that are listed on FAA records and considered to be in the U.S. inventory.
Export Data: These numbers include both airplanes and helicopters. The numbers do not include aircraft that have empty weights in excess of 33,069 lbs.
Single/Multi: The blue line in the Single/Multi chart depicts change-of-ownership data for singles. The green line represents multis.
Jet/Turboprop/Heli: The dark blue line in the Jet/Turboprop/Heli chart represents change-of-ownership information for jets. The green line depicts turboprops, and the light blue line represents helicopters.
Total Market: Depicts change-of-ownership data for all aircraft included in the Aircraft Bluebook. The numbers are from the FAA Registry. Gliders, homebuilts, airliners and other aircraft not found in the Bluebook are not included in this study.
Charts