in  Charts
Charts 


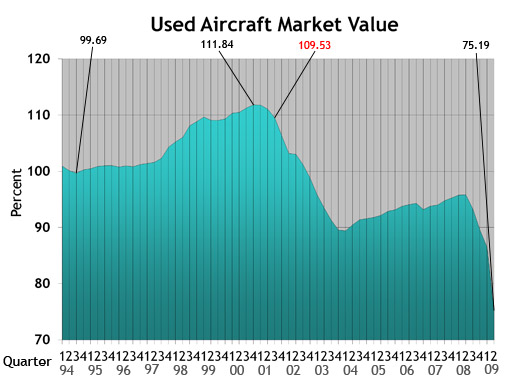
Used Aircraft Market: This chart displays each model's quarterly value in relationship to its average equipped price at the inception of the aircraft. The study begins in the spring quarter of 1994 and includes the Jet, Turboprop, Multi, Piston and Helicopter. For all charts, the red number indicates the first reporting date after 9-11.
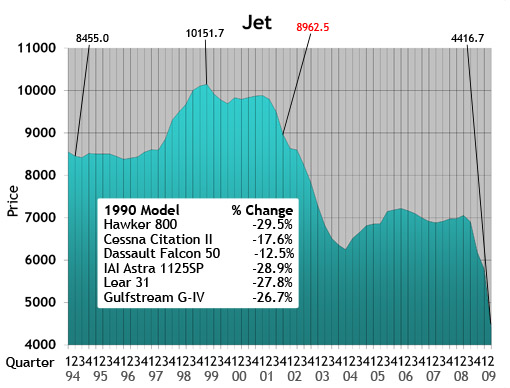
Jet: The jet chart depicts the average price (in thousands) of the six 1990s jets listed in the box.
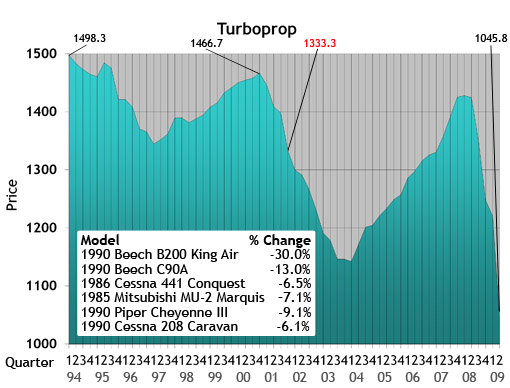
Turboprop: The turboprop chart depicts the average price (in thousands) of a 1985, 1986 and four 1990 turboprops listed in the box.
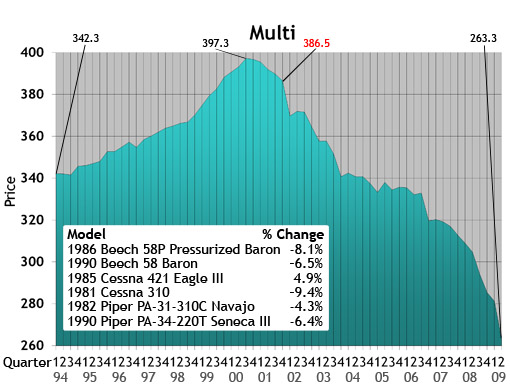
Multi: The multi chart depicts the average price (in thousands) of the six multi models listed in the box. Each model’s year will precede the name of the aircraft.
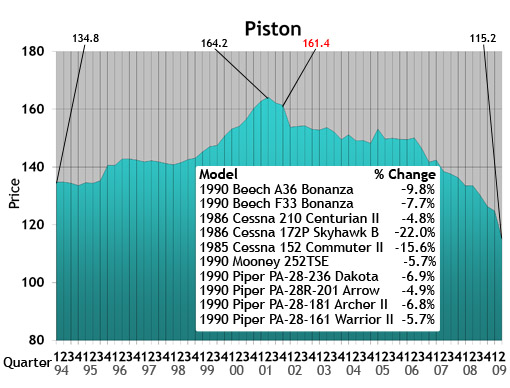 Piston: The piston chart depicts the average price (in thousands) of the 10 pistons listed in the box. Each model’s year will precede the name of the aircraft.
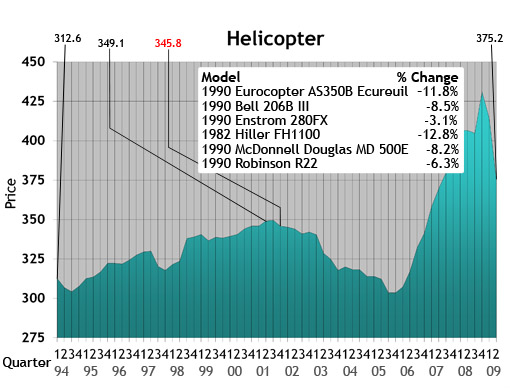
Helicopter: The helicopter chart depicts the average price (in thousands) of the six helicopters listed in the box. Each model’s year will precede the name of the aircraft.
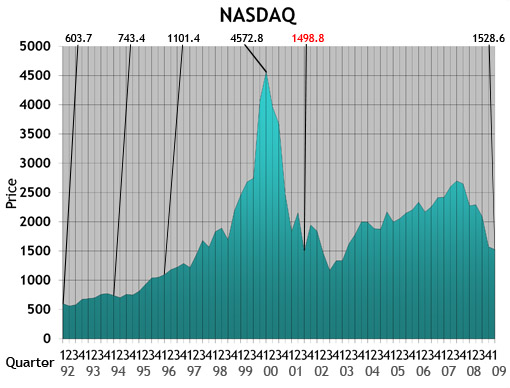
NASDAQ: This ratio scale chart depicts the change for the NASDAQ daily average from quarter to quarter beginning at the end of the first quarter of 1992. Each data point represents the closing daily average on the last trading day of each quarter. This study originates in the first quarter of 1971.
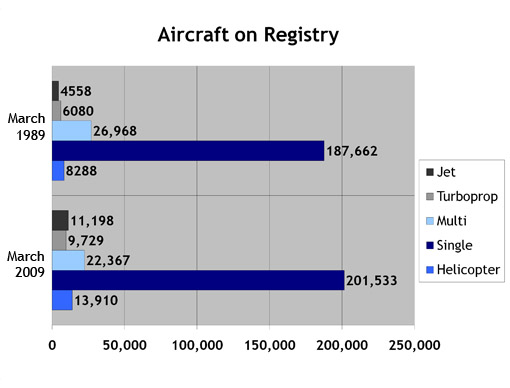 Aircraft on Registry: The Aircraft on Registry chart depicts the number of aircraft reported in Aircraft Bluebook that are listed on FAA records and considered to be in the U.S. inventory.
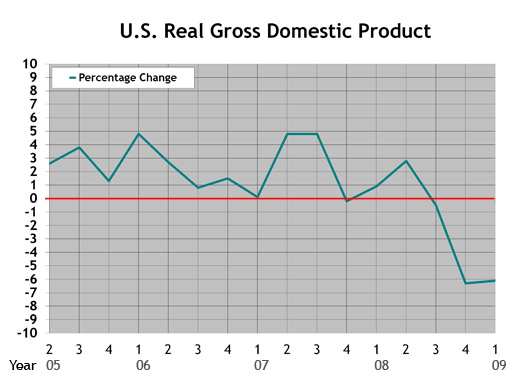
U.S. Real Gross Domestic Product: This graph represents real gross domestic product measured by the U.S. Department of Commerce. Each data point represents the percentage change from the 2005 baseline GDP. The study begins with the second quarter in 2005.
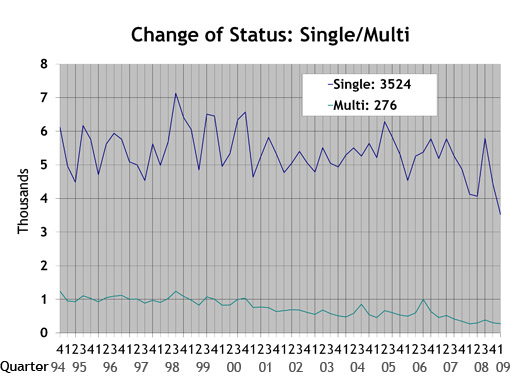
Single/Multi: The blue line in the Single/Multi chart depicts change-of-status data for singles. The green line represents multis.
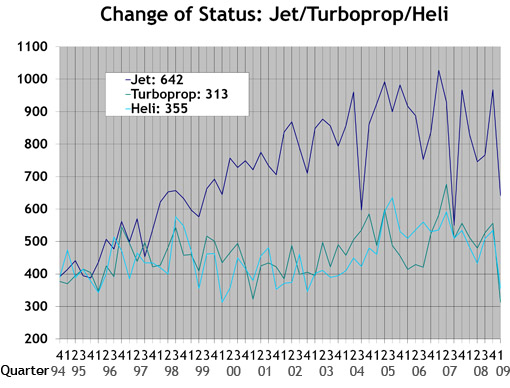
Jet/Turboprop/Heli: The dark blue line in the Jet/Turboprop/Heli chart represents change-of-status information for jets. The green line depicts turboprops, and the light blue line represents helicopters.

Total Market: Depicts change-of-status data for all aircraft included in the Aircraft Bluebook. The numbers are from the FAA Registry. Gliders, homebuilts, airliners and other aircraft not found in the Bluebook are not included in this study.
Reader Comments (4)
It has always been my understanding that the values in the Aircraft Bluebook was completely based on aircraft sales. Which means the value they sold for was averaged out per make and model and Aircraft Bluebook showed those numbers as Retail and Wholesale. I know that many of the changes made to the summer issue and to my knowledge there were no sales in the particular catagory and the numbers went down drastically without any sales proof. Thus all the bankers, aircraft owners, and dealers are outraged. It has to be some common ground are the whole system will fall and none of us want that. Aircraft Bluebook must only list prices of aircraft that they can truely back up from reliable sources that can be proven in a court of law should it ever come down to that. Respectfully, Sammy Lee
It has always been my understanding that the values in the Aircraft Bluebook was completely based on aircraft sales. Which means the value they sold for was averaged out per make and model and Aircraft Bluebook showed those numbers as Retail and Wholesale. I know that many of the changes made to the summer issue and to my knowledge there were no sales in the particular catagory and the numbers went down drastically without any sales proof. Thus all the bankers, aircraft owners, and dealers are outraged. It has to be some common ground are the whole system will fall and none of us want that. Aircraft Bluebook must only list prices of aircraft that they can truely back up from reliable sources that can be proven in a court of law should it ever come down to that. Respectfully, Sammy Lee
The market is completely petrified and frozen in fear.I doubt if anyone can stimulate any buyer interest at any price. Right now, there seems to be some evidence that sales are being executed at about 1/2 of Blue book asking retail price. If that is in fact the case,then the blue book should so state.
Reason and common sense are some of the key factors in perception. True, some aircraft makes and models have limited sales data. With this said, specific aircraft segments do not operate in a vacuum. Values have always trended according to the particular market dynamics within the pre-owned market. The Bluebook has always identified and constantly reviewed these relationships. If a particular model has no activity in this market, it is reasonable to assume either the posted values are too high, or there is a total lack of market interest. In either case, such conclusions would support reductions in value. Trending values in a price guide is nothing new. In the final analysis, the judge and jury is not the Bluebook. The real judge and jury will always be the checkbook.