


CHANGE IS IN THE AIR
Exceptional Values for Late Model Cabin Class Jets
Vol. 25, No. 1 | March 1, 2012 | Go to Charts
by Carl Janssens, ASA | Aircraft Bluebook — Price Digest
Change is in the air, literally. Market activity for late model large cabin class business jets is on the rise. These new or late models jets are experiencing competitive pricing. Could this be considered a price war? In addition to all of this, an increasing number of sales are bound for export to Asia. 2012 appears to be on a jump start for transactions. For buyers, this has become one of the best opportunities for acquisitions. At some point, supply will no longer be able to meet the demand for the late model large cabin jet. All of the evidence points to a not-so-soft market. As history is cyclic and the market is in a trough for values, can you guess where pricing is heading in this market segment?
For the mid-range and light jet business aircraft, values continue to slightly decline. One of the reasons is the adequate supply of inventory available for sale. Outside of pricing, these are the workhorses of business aviation. These jet segments are more impacted by the volume of well-equipped late models available for sale. Until inventories of bargain-priced jets have been eliminated, expect values to remain artificially low. Buyers no doubt recognize these great opportunities not so much as an investment in equity but a means to get the job done for revenue growth. And who knows, when artificially low pricing is exhausted by demand, it may be the icing on the cake so to speak as these values become firm.
;) In the turboprop market, activity continues to improve while values continue experience stability. Age, condition and equipment continue to be dominating factors. At the same time, legacy turbo props, those manufactured in the 20th century, appear to be enjoying an active market. Noting the Aircraft Bluebook– at–a–Glance monitor (see chart on right), this market segment is relatively stable when compared to the previous quarter.
In the turboprop market, activity continues to improve while values continue experience stability. Age, condition and equipment continue to be dominating factors. At the same time, legacy turbo props, those manufactured in the 20th century, appear to be enjoying an active market. Noting the Aircraft Bluebook– at–a–Glance monitor (see chart on right), this market segment is relatively stable when compared to the previous quarter.
For agriculture turbo props, late model agriculture sprayers are in short supply. And, if one is shopping new, expect delays as current production is already spoken for. Pricing will continue to hold strong for these late model aircraft. Overall, this industry segment remains stable. Check your Bluebook for values.
In the multi and single piston market, values appear to be for the most part stable as displayed on the Aircraft Bluebook–at–a–Glance monitor. More opportunities for the majority of the pilot population here in the USA are represented in this segment. This means those folks who fly and maintain the “big stuff” may have one of these in their hangar for personal or business use.
This segment is also a stepping stone. For some, it is part of the transition process of moving up to more complex aircraft, and, for others, the opposite. In any case, lots of activity makes for a healthy market. For the helicopter market, the recession is over. Values are stable and there is a broad base of activity in this market segment. Two key factors that keep this industry on the go are quality of life issues that are always on the forefront: security and energy.
Aircraft Bluebook – Price Digest here for you
Please contact Aircraft Bluebook if you have any specific concern in a particular aircraft market. We will be happy to share with you the most up-to-date information available for your market segment. Call us toll-free at 877-531-1450 or direct at 913-967-1956.
[Go to Charts.]
[Download or print PDF of this article and All Charts.]
 Aircraft Bluebook Marketline
CHARTS — MARCH 1, 2012
CURRENT MARKET STRENGTH
;) Click to View Full Size ChartCMS represents an aircraft’s current strength in the market. An A+ rating indicates the aircraft is enjoying a very firm market. Prices for an A+ aircraft are steadily rising, and holding times are very short or nonexistent. At the opposite end of the spectrum, a C- aircraft is one experiencing a very soft market. Its price is commonly discounted, and it often sets on the ramp in excess of eight months before selling. It is important to remember that Current Market Strength is not a forecast. It is valid only at Marketline’s effective date of release.
Click to View Full Size ChartCMS represents an aircraft’s current strength in the market. An A+ rating indicates the aircraft is enjoying a very firm market. Prices for an A+ aircraft are steadily rising, and holding times are very short or nonexistent. At the opposite end of the spectrum, a C- aircraft is one experiencing a very soft market. Its price is commonly discounted, and it often sets on the ramp in excess of eight months before selling. It is important to remember that Current Market Strength is not a forecast. It is valid only at Marketline’s effective date of release.
MARKETLINE CHARTS
;) All of the listed aircraft have a composite score that is presented in the Used Aircraft Market graph. Data points are represented in relationship to the respective new delivered historical price that is equal to 100%. The measure of change is reported in the actual percentage of value in relation to new. The delta between reporting periods can be concluded as the percentage of change.
All of the listed aircraft have a composite score that is presented in the Used Aircraft Market graph. Data points are represented in relationship to the respective new delivered historical price that is equal to 100%. The measure of change is reported in the actual percentage of value in relation to new. The delta between reporting periods can be concluded as the percentage of change.
Click any chart to view it Full Size
Click here to download a PDF of the full Marketline Newsletter, including articles and all Charts.
;)
;)
;)
;)
;)
;)
DISPARATE PRE-OWNED AIRCRAFT MARKETS EMERGE
What Goes Around Comes Around During Economic Recoveries
Vol. 24, No. 3 | September 13, 2011 | Go to Charts
by Carl Janssens, ASA | Aircraft Bluebook — Price Digest
Pick your adjective.
A wide disparity exists in today’s pre-owned business aircraft market, and just about any adjective will accurately describe some part of the market.
Great can be used to describe late-model large-cabin global business jets, which include models such as the Global XRS, Dassault Falcon 7X and Gulfstream G550.
Then there is the awful when dealing with a legacy business jet punching through its 30th anniversary of service.
For a while now, there have been at least two distinct markets. This scenario is not news, yet many in this industry seem puzzled about market dynamics.
Why does the pre-owned market appear to be good, bad and confused? The answer is the closed traffic pattern around the economy. As the recovery stumbles along, confidence remains shaky. We can’t break out of the pattern. To make matters murkier, the preseason presidential election rallies are in full swing with the all-out campaigns next. Oh joy.
For this edition of Marketline, I could not find an angle that hasn’t already been explored by someone else. I went to the Bluebook archives and pulled out an Aircraft Bluebook Marketline from 1992 for inspiration, and I think I have found a good way to predict what’s next in the economy. Even in this lethargic economic recovery, what goes around comes around. Historically, there has always been an economic recovery followed by a peak and then another slow down.
Marketline has done a pretty good job at reporting trends. The pre-owned market knows its position in this cycle. Someone out there is bound to make the calculated decision to buy now rather than later realizing the upswing is on the way.
Jet
Bluebook-at-a-glance
Increased — 9
Decreased — 353
Stable — 561
The jet segment experienced few positive moves. Early Citation Sovereigns edged upward. The Gulfstream G550 saw the greatest value increase — by more than $2 million.
Decreases affected all categories. The majority of the jet market was reported as stable, though.
Turboprop
Bluebook-at-a-glance
Increased — 23
Decreased — 74
Stable — 508
The turboprop market continued to demonstrate signs of stability, which are good signs of an economic recovery in progress. Turbine-powered ag planes continue to be nearly nonexistent in the resale market. Late-model twins, such as the Beech King Air 350i and the B200GT, likewise are nearly unavailable. Inventories available for sale held in check or slightly increased when compared to the previous quarter.
Multi
Bluebook-at-a-glance
Increased — 58
Decreased — 17
Stable — 582
Single
Bluebook-at-a-glance
Increased — 144
Decreased — 225
Stable — 2174
The piston segment has had the least amount of price change activity. Even though sale prices were stationary when compared to last quarter, transactions were on the rise. (Refer to the graphs that follow.) Bargain hunters also appeared to have given up their quest for the deal of the day and have taken their place on the fence to wait and see. Wait too long, and it might cost more to buy tomorrow.
Helicopter
Bluebook-at-a-glance
Increased — 65
Decreased — 92
Stable — 910
Helicopters are continuing to show some signs of stabilization. Reported values for the majority of this segment remained unchanged when compared to the previous quarter. The Robinson R44 and R22 continued to edge upward about $8000 to $9000 in retail value.
Aircraft Bluebook – Price Digest here for you
Please contact Aircraft Bluebook if you have any specific concern in a particular aircraft market. We will be happy to share with you the most up-to-date information available for your market segment. Call us toll-free at 877-531-1450 or direct at 913-967-1956.
[Go to Charts.]
CHARTS — SEPT. 13, 2011
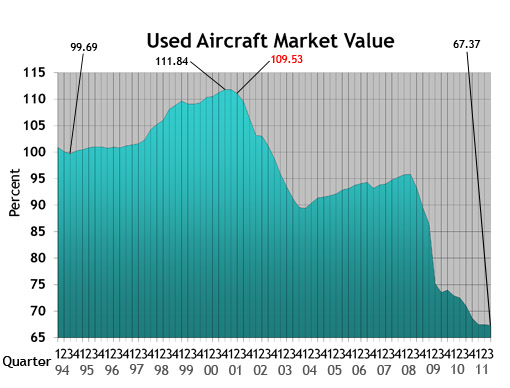 Used Aircraft Market: This chart displays each model's quarterly value in relationship to its average equipped price at the inception of the aircraft. The study begins in the spring quarter of 1994 and includes the Jet, Turboprop, Multi, Piston and Helicopter. For all charts, the red number indicates the first reporting date after 9-11.
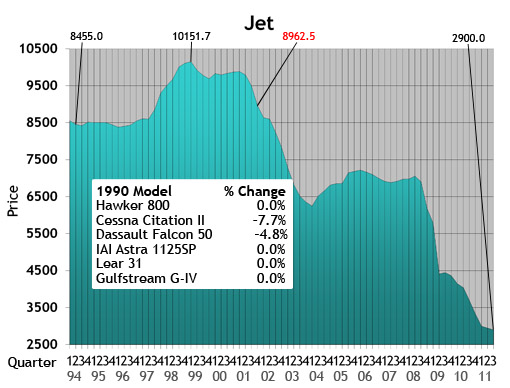 Jet: The jet chart depicts the average price (in thousands) of the six 1990s jets listed in the box.
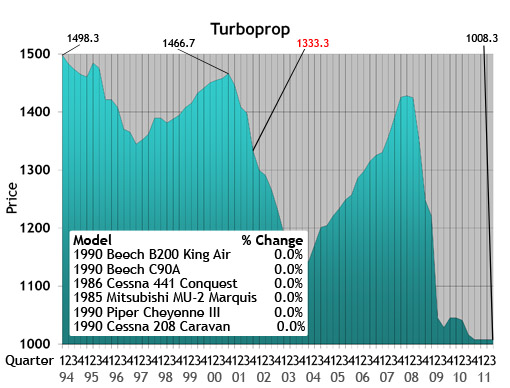 Turboprop: The turboprop chart depicts the average price (in thousands) of a 1985, 1986 and four 1990 turboprops listed in the box.
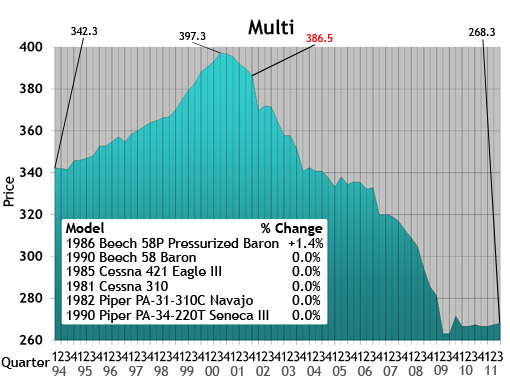 Multi: The multi chart depicts the average price (in thousands) of the six multi models listed in the box. Each model’s year will precede the name of the aircraft.
 Piston: The piston chart depicts the average price (in thousands) of the 10 pistons listed in the box. Each model’s year will precede the name of the aircraft.
 Helicopter: The helicopter chart depicts the average price (in thousands) of the six helicopters listed in the box. Each model’s year will precede the name of the aircraft.
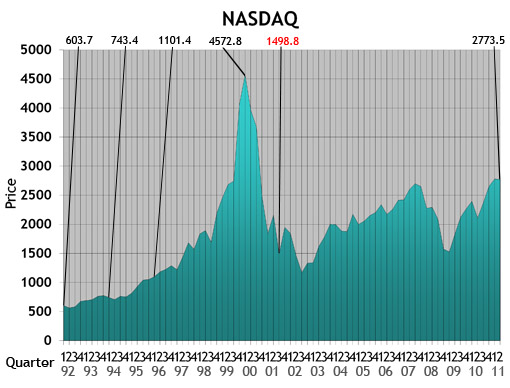 NASDAQ: This ratio scale chart depicts the change for the NASDAQ daily average from quarter to quarter beginning at the end of the first quarter of 1992. Each data point represents the closing daily average on the last trading day of each quarter. This study originates in the first quarter of 1971.
 Aircraft on Registry: The Aircraft on Registry chart depicts the number of aircraft reported in Aircraft Bluebook that are listed on FAA records and considered to be in the U.S. inventory.
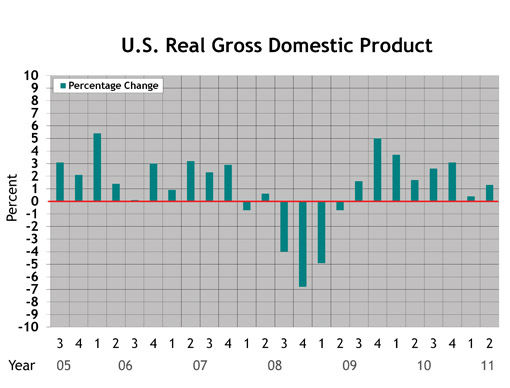 U.S. Real Gross Domestic Product (criteria updated Aug. 27, 2010): This graph represents real gross domestic product measured by the U.S. Bureau of Economic Analysis. Each data point represents the BEA's final figure or latest estimate of the quarter-to-quarter seasonally adjusted annual rates of change in real GDP "based on chained 2005 dollars." The study begins with the second quarter in 2005.
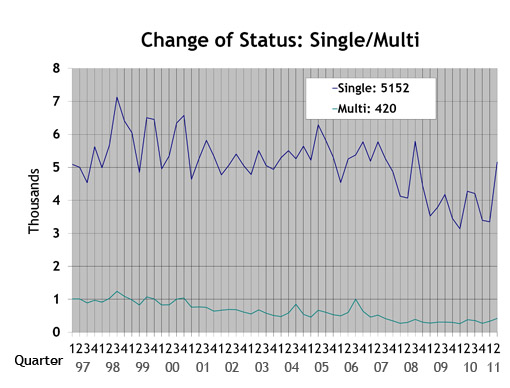 Single/Multi: The blue line in the Single/Multi chart depicts change-of-ownership data for singles. The black line represents multis.
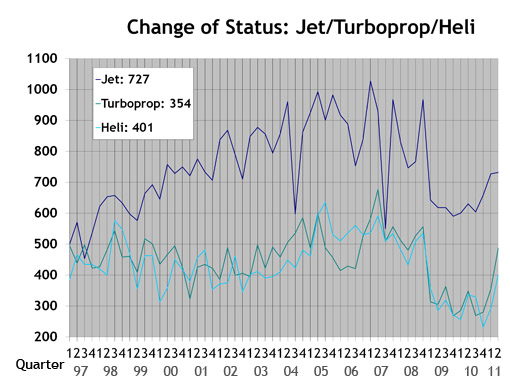 Jet/Turboprop/Heli: The black line in the Jet/Turboprop/Heli chart represents change-of-ownership information for jets. The blue line depicts turboprops, and the gray line represents helicopters.
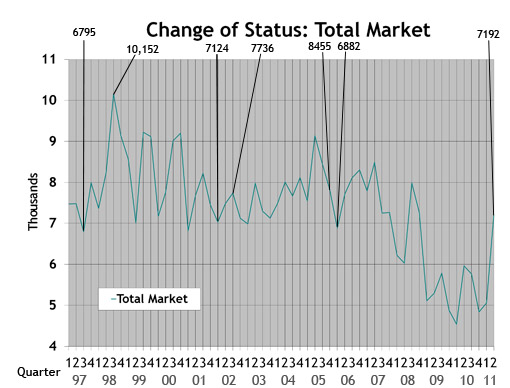 Total Market: Depicts change-of-ownership data for all aircraft included in the Aircraft Bluebook. The numbers are from the FAA Registry. Gliders, homebuilts, airliners and other aircraft not found in the Bluebook are not included in this study.
AEROSHELL AT-6 TEXANS FLY FORMATION LOOPS AT OSHKOSH (VIDEO)
Aircraft Bluebook–Price Digest's Chris Reynolds shot some video of the AeroShell team performing formation loops in its North American AT-6 Texans at the Experimental Aircraft Association's AirVenture 2011 show in Oshkosh, Wis.
The AT-6 Texan aircraft made its debut in 1938. It served as basic training aircraft for the U.S. Army Air Corps.
The AeroShell team has flown in air shows for more than 20 years.