


Entries in turboprop (44)
MARKETLINE FALL 2013 EDITION
Vol. 26, No. 3 | Sept 10, 2013 | Go to Charts
IN THIS ISSUE
Bluebook Perspectives: Value Retention In Today's Market
Into the Blue: Penton Completes Acquisition of Aviation Week Group From McGraw Hill Financial
Ask Aircraft Bluebook: How can I submit information to Aircraft Bluebook?
[Download the full Fall 2013 Marketline Newsletter and All Charts.]
Value Retention In Today's Market:
By Dennis Rousseau | President and Founder | AircraftPost.com
 There has been conversation and many questions over the last few years relating to residual values, value retention, value as a percentage of cost new, values coming back, et al. For years, our industry used a 3 to 4 percent annualized depreciation schedule to gauge future values for business jets. Due to the fact our business was in its infancy, we did not possess formidable history to determine the validity of the schedule. When we buy-in to the fundamental assumption that aircraft are depreciating assets with a 30-year life cycle, most business jets will reflect an average midlife (15 years) value retention of 50 percent, when compared to the original cost new.
As illustrated in the data sheet, we’ve made every attempt to compare aircraft in an equal light. For out of production aircraft we use a 1999-year model reflecting 14-years in service. For current production business jets, a 2007-year model is used reflecting 6-years in service. Regardless of the term, each make/model is generating nine to ten percent annualized depreciation. For each year through 2013 we’ve calculated the average [pre-owned] selling price for the respective model. The original price new reflects the average contract price for each make/model for the stated year.
Clearly, these numbers should not be construed as ‘one size fits all.’ Each transaction and make/model comes with its own set of dynamics. However, aircraft with greater capability (higher passenger loads, transcontinental range, increased performance, later generation avionics, etc.) tend to retain a higher percentage of their original cost new. In the majority of cases, there seems to be a corollary between the total aircraft manufactured and lower resale value—the greater the number built, competitive landscape increases and value retention erodes quicker. As of July 2013, AircraftPost calculated an average ten percent of current generation business jet fleets on the market. The range is from 2 percent of the fleet for the G550 to 22 percent for the Lear 60XR. In the case of the former, an anomaly exists. There are now over 425 G550s in-service which would lend one to believe, based on the above-mentioned criteria, that early year models should be retaining less of their original cost new. Current data however, reflects the opposite.
As evidenced recently in pre-owned markets, selling prices continue a downward trend. As newer generation avionics are installed in the next iteration aircraft (i.e., Global Express/XRS/Global 6000; Lear 60/60XR; GIV/IVSP/450, etc.), these newer aircraft will place more pressure on pre-owned aircraft. The rate selling prices decline is determined in part by the above-mentioned and also driven by global economic factors. With the eroding geopolitical situation in the Middle East, South America and Asia, countries like the U.S. and Japan accruing debt of $16 and $10 trillion, respectively, it’s a wonder our markets are generating the sales they are.
Where do we go from here? In a nutshell, if our dollar continues to lose value, the price of most everything goes up. Does that include pre-owned aircraft that have been selling well under ‘normalized markets?’;)
Aircraft Bluebook – Price Digest here for you
Please contact Aircraft Bluebook if you have any specific concern in a particular aircraft market. We will be happy to share with you the most up-to-date information available for your market segment. Call us toll-free at 877-531-1450 or direct at 913-967-1956.
[Go to Charts]
 Aircraft Bluebook Marketline
CHARTS — Sept 10, 2013
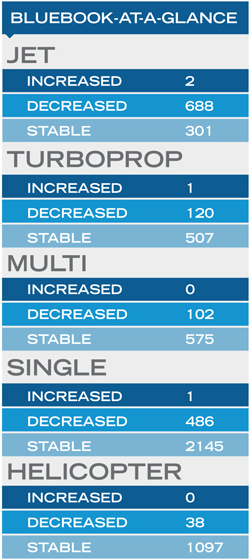
CURRENT MARKET STRENGTH
;) Click to View Full Size ChartCMS represents an aircraft’s current strength in the market. An A+ rating indicates the aircraft is enjoying a very firm market. Prices for an A+ aircraft are steadily rising, and holding times are very short or nonexistent. At the opposite end of the spectrum, a C- aircraft is one experiencing a very soft market. Its price is commonly discounted, and it often sets on the ramp in excess of eight months before selling. It is important to remember that Current Market Strength is not a forecast. It is valid only at Marketline’s effective date of release.
Click to View Full Size ChartCMS represents an aircraft’s current strength in the market. An A+ rating indicates the aircraft is enjoying a very firm market. Prices for an A+ aircraft are steadily rising, and holding times are very short or nonexistent. At the opposite end of the spectrum, a C- aircraft is one experiencing a very soft market. Its price is commonly discounted, and it often sets on the ramp in excess of eight months before selling. It is important to remember that Current Market Strength is not a forecast. It is valid only at Marketline’s effective date of release.
MARKETLINE CHARTS
;) Click to View Full Size ChartAll of the listed aircraft have a composite score that is presented in the Used Aircraft Market graph. Data points are represented in relationship to the respective new delivered historical price that is equal to 100%. The measure of change is reported in the actual percentage of value in relation to new. The delta between reporting periods can be concluded as the percentage of change.
Click to View Full Size ChartAll of the listed aircraft have a composite score that is presented in the Used Aircraft Market graph. Data points are represented in relationship to the respective new delivered historical price that is equal to 100%. The measure of change is reported in the actual percentage of value in relation to new. The delta between reporting periods can be concluded as the percentage of change.
Click here to download a PDF of the full Marketline Newsletter, including articles and all Charts.
;) Click to View Full Size Chart
Click to View Full Size Chart ;) Click to View Full Size Chart
Click to View Full Size Chart;) Click to View Full Size Chart
Click to View Full Size Chart ;) Click to View Full Size Chart
Click to View Full Size Chart ;) Click to View Full Size Chart
Click to View Full Size Chart ;) Click to View Full Size Chart
Click to View Full Size Chart
MARKETLINE SUMMER 2013 EDITION
Vol. 26, No. 2 | June 10, 2013 | Go to Charts
IN THIS ISSUE
Bluebook Perspectives: YTD Pre-owned Transactions & Prices Continue Down
Into the Blue: Aircraft Bluebook At-a-Glance, Cessna 177 Cardinal Series
Ask Aircraft Bluebook: Where can I find the Aircraft Spec Charts and other infomation formerly in print?
[Download the full Summer 2013 Marketline Newsletter and All Charts.]
YTD PRE-OWNED TRANSACTIONS & PRICES CONTINUE DOWN:
By Dennis Rousseau | President and Founder | AircraftPost.com
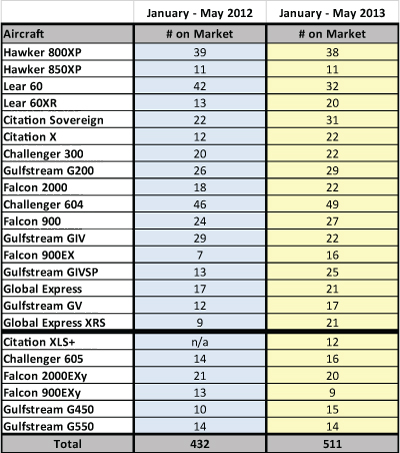
 When viewing a random selection of pre-owned transactions for the first 5-months of 2013, the number of sales are trending down 15 percent when compared to the same period in 2012. Actual selling prices also are down on average 15 percent, while inventory levels for the same group of business jets has increased 20 percent.
As you consider these facts we must also take into account other mitigating factors, such as the year of manufacture of the aircraft sold, cost of the aircraft when it was new, the cost new today, as well as nominal depreciation, et al. By way of example, an aircraft that sold new in 2005 for $44 million and today sells for $32 million is not too far off of a 4 percent per year depreciation schedule. From another perspective, it has retained 73 percent of its original cost , which falls in line with a 30-year useful life.
A number of factors continue to affect growth and stability in our industry – some are geopolitical, others are related to the global financial debacle that started in 2008.
Within our industry, where 250 aircraft were once considered a standard production run, we now have 400+ that will eventually compete in the pre-owned market. Therein in the case of ‘over-production’, we face dynamics that were once not a factor, such as eroding residual values. As the business jet fleet ages and pre-owned inventory increases, will pricing continue to erode? What effect will new aircraft pricing and shorter delivery times have on the pre-owned market?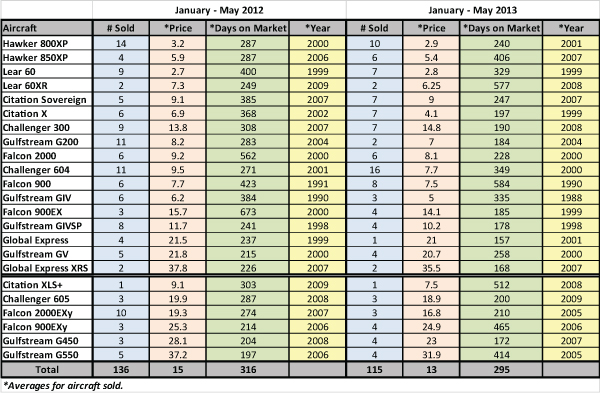
Aircraft Bluebook – Price Digest here for you
Please contact Aircraft Bluebook if you have any specific concern in a particular aircraft market. We will be happy to share with you the most up-to-date information available for your market segment. Call us toll-free at 877-531-1450 or direct at 913-967-1956.
[Go to Charts]
CHARTS — June 10, 2013
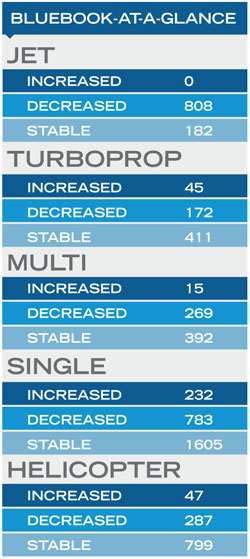
CURRENT MARKET STRENGTH
;) Click to View Full Size ChartCMS represents an aircraft’s current strength in the market. An A+ rating indicates the aircraft is enjoying a very firm market. Prices for an A+ aircraft are steadily rising, and holding times are very short or nonexistent. At the opposite end of the spectrum, a C- aircraft is one experiencing a very soft market. Its price is commonly discounted, and it often sets on the ramp in excess of eight months before selling. It is important to remember that Current Market Strength is not a forecast. It is valid only at Marketline’s effective date of release.
Click to View Full Size ChartCMS represents an aircraft’s current strength in the market. An A+ rating indicates the aircraft is enjoying a very firm market. Prices for an A+ aircraft are steadily rising, and holding times are very short or nonexistent. At the opposite end of the spectrum, a C- aircraft is one experiencing a very soft market. Its price is commonly discounted, and it often sets on the ramp in excess of eight months before selling. It is important to remember that Current Market Strength is not a forecast. It is valid only at Marketline’s effective date of release.
MARKETLINE CHARTS
;) Click to View Full Size ChartAll of the listed aircraft have a composite score that is presented in the Used Aircraft Market graph. Data points are represented in relationship to the respective new delivered historical price that is equal to 100%. The measure of change is reported in the actual percentage of value in relation to new. The delta between reporting periods can be concluded as the percentage of change.
Click to View Full Size ChartAll of the listed aircraft have a composite score that is presented in the Used Aircraft Market graph. Data points are represented in relationship to the respective new delivered historical price that is equal to 100%. The measure of change is reported in the actual percentage of value in relation to new. The delta between reporting periods can be concluded as the percentage of change.
Click here to download a PDF of the full Marketline Newsletter, including articles and all Charts.
;) Click to View Full Size Chart
Click to View Full Size Chart ;) Click to View Full Size Chart
Click to View Full Size Chart;) Click to View Full Size Chart
Click to View Full Size Chart ;) Click to View Full Size Chart
Click to View Full Size Chart ;) Click to View Full Size Chart
Click to View Full Size Chart ;) Click to View Full Size Chart
Click to View Full Size Chart
MARKETLINE SPRING 2013 EDITION
Vol. 26, No. 1 | March 11, 2013 | Go to Charts
IN THIS ISSUE
Bluebook Perspectives: Pre-Owned Transactions on the Rise
Into the Blue: Aircraft Bluebook At-a-Glance, Piper Malibu Meridian, PA-46-500TP series
Ask Aircraft Bluebook: Can I access Aircraft Bluebook from outside the United States?
[Download the full Spring 2013 Marketline Newsletter and All Charts.]
PRE-OWNED TRANSACTIONS ON THE RISE:
By Dennis Rousseau | President and Founder | AircraftPost.com
 For the fifth consecutive year, pre-owned transactions for current generation business jets have shown a year over year increase. However, market inventories, expressed as a percentage of the fleet, are on the rise, while the average selling price continues a downward trend.
When we factor age-based depreciation over a 30-year lifecycle, we can garner some semblance of normalized value at any given point. However, when we consider economic events such as those over the last four years, values and selling prices can take a drastic downward turn. At the end of 2012, the average selling price for pre-owned, current production aircraft was reflecting a 17% decline in market value. Out of production aircraft slipped further to 33% under normalized values.
There are a number of factors contributing to the state of our market(s). The increase in transactions and current pricing suggests buyers are realizing substantial value in select aircraft. For example the G200, with its stand-up cabin, 3000 nm range and Pro Line 4 cockpit, had a record 27 transactions in 2012, an increase of over 300% from 2011. A 2008 year model, with a list price new of $22M, sold for $10M in the 4th Quarter 2012, with under 800 hours total time. The same $10M could buy a 2001 Challenger 604 or Falcon 2000 with 3500 hours, or a 2004 Challenger 300 with 7500 hours. Buyers seem to be looking more laterally with the perception of ‘how much value can I buy for the same dollar.’ Obviously, the newer aircraft open up greater financing opportunities as well.
Compared to 2008, when pre-owned aircraft were selling for more than they cost new, 2012 continued to adjust prices to a level commensurate with the global economic climate. On average, pre-owned business jets are selling 25% under normalized markets, which seems to be one of the driving factors for the increased transactions. Further, according to GAMA new business jet deliveries for the first nine months of 2011 and 2012 were 427 and 428 respectively. When current production pre-owned aircraft are selling for 40% less than they cost new, this can also stimulate the number of pre-owned transactions.
For the start of 2013, pre-owned inventories are on the rise; however activity levels (pre-purchase inspections, LOIs, Offers to Purchase, et al) are showing formidable signs for consistent activity.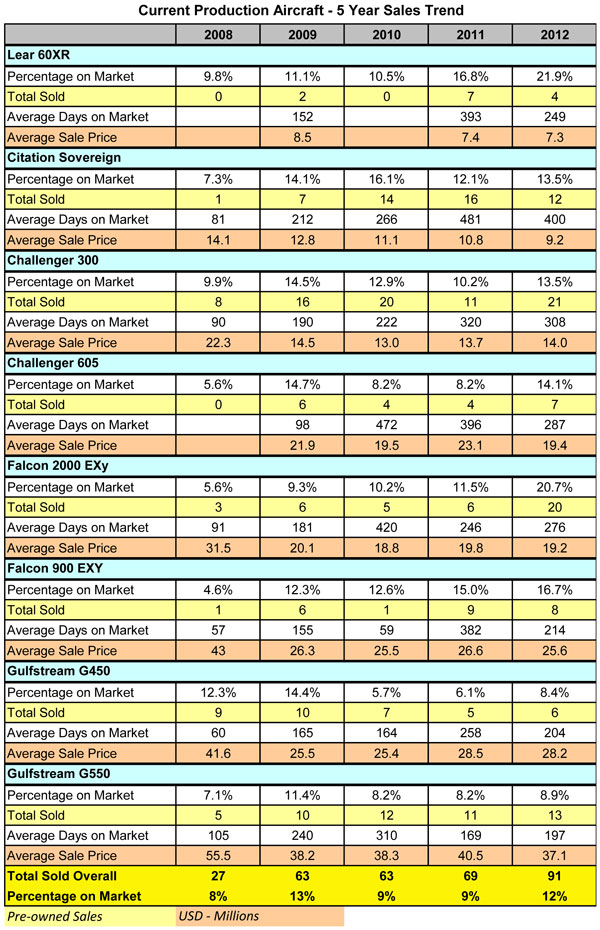

Aircraft Bluebook – Price Digest here for you
Please contact Aircraft Bluebook if you have any specific concern in a particular aircraft market. We will be happy to share with you the most up-to-date information available for your market segment. Call us toll-free at 877-531-1450 or direct at 913-967-1956.